 Welcome to the tutorial about creating queries in SAP BEx Query Designer. This tutorial is part of SAP BW course. After completing this tutorial, you will learn how to design a simple query (based on a real-life scenario) and then execute it in BEx Analyzer.
If this is the first time you’re trying to create a simple query in SAP BEx Query Designer, then this is the right tutorial for you. This tutorial explains how to create a query in Query Designer and how to view the extracted output by executing the query in BEx Analyzer. This tutorial elucidates the steps involved in this process.
Real-Life Scenario
Every report has an underlying business need. Let’s consider an example with the following business objective: create a report that shows delivery data. Please find the mockup of the report given below.
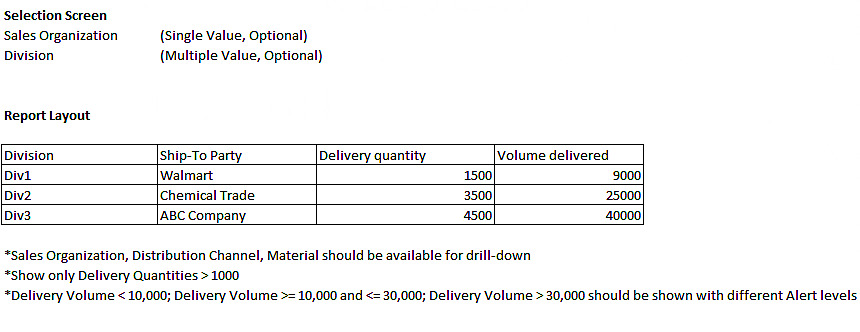
For the ease of understanding, this tutorial is divided into the following two sections:
- Creating the Query
- Executing the Query
SAP BEx Query Designer: Creating the Query
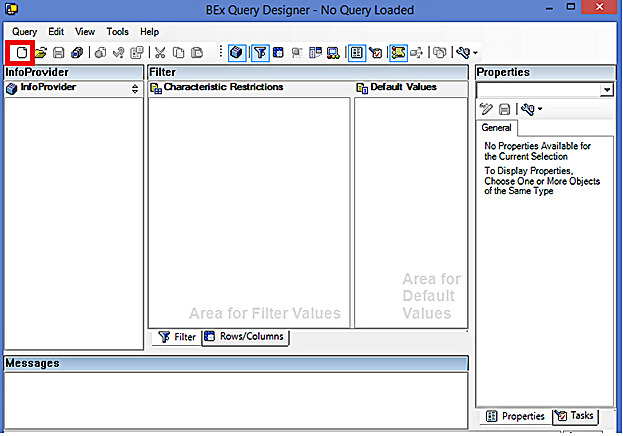
To start creating a new query, you have to click on “New Query” button as shown below:
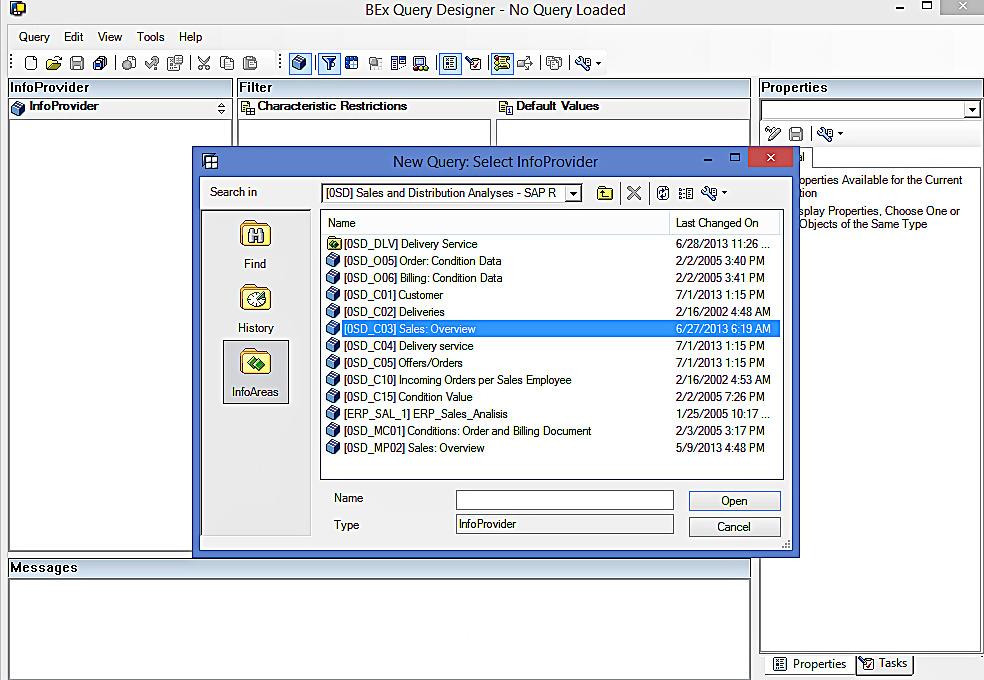
Now, you should mention the InfoProvider on which you want to create the query. The InfoAreas button will display the hierarchy of InfoProviders available in your BW system. This tutorial uses a InfoCube delivered by SAP as InfoProvider. In this tutorial, I am selecting 0SD_C03 InfoCube. You can however have the option to base your query on custom InfoProviders that you create as per your requirements.
As can be seen from the below screenshot, the InfoProvider structure in the Query Designer has folders such as Key Figures and Dimensions.

If you take a look back at the mockup, we can infer that the query we build should have the following elements.
Rows: Division, Ship-To-Party
Columns: Delivery quantity, Volume delivered
Free Characteristics: Sales Organization, Distribution Channel, Material
Filters: Sales Organization, Division
Now, I will drag and drop Division and Ship-To-Party characteristics to the Rows section.
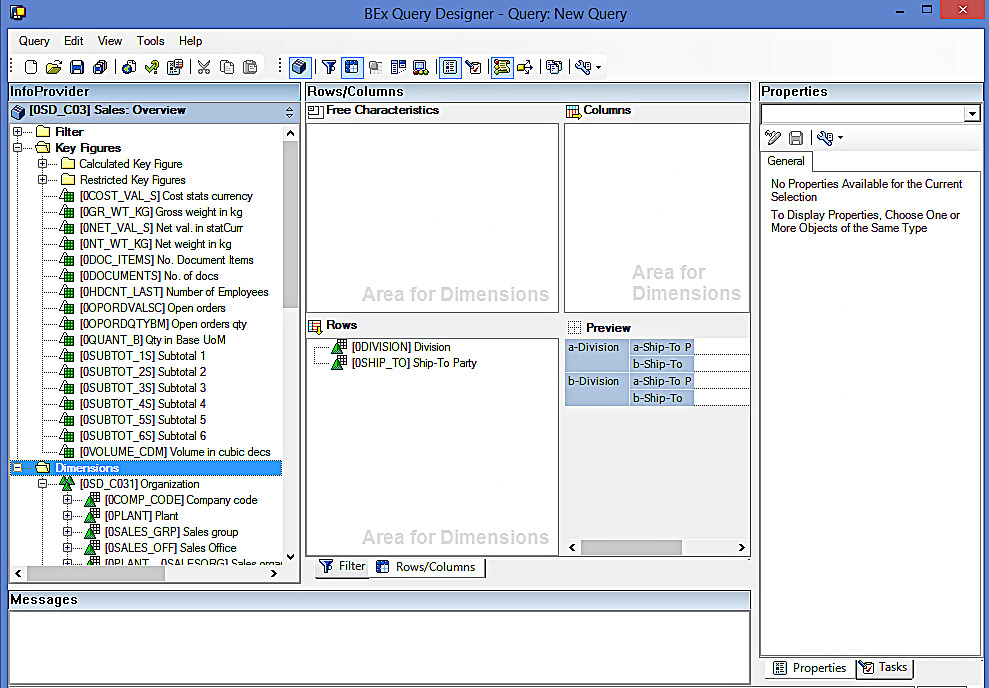
Similarly, I will drag and drop Delivery quantity and Volume delivered Restricted Key Figures to the Columns section.
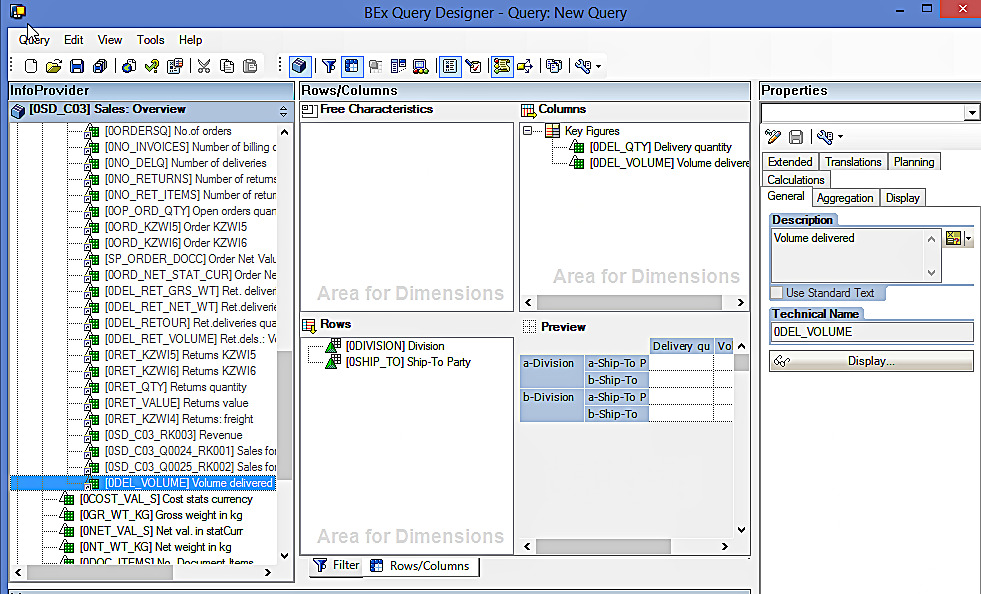
Also, make sure that you add free characteristics as per the client’s requirements. In our mockup, you can see that Sales Organization, Distribution Channel, and Material should be free characteristics. Hence, drag and drop these InfoObjects to the Free Characteristics section.
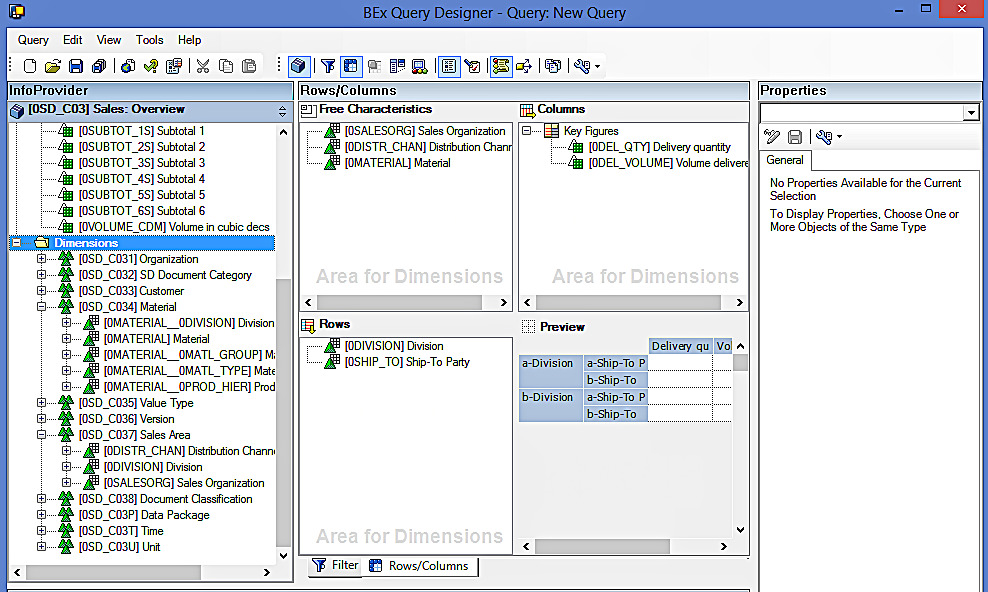
Let’s now create two new variables, one for Sales Organization and the other for Division. The mockup mentions that Sales Organization is optional and single value variable. Hence, we will create a variable as follows:
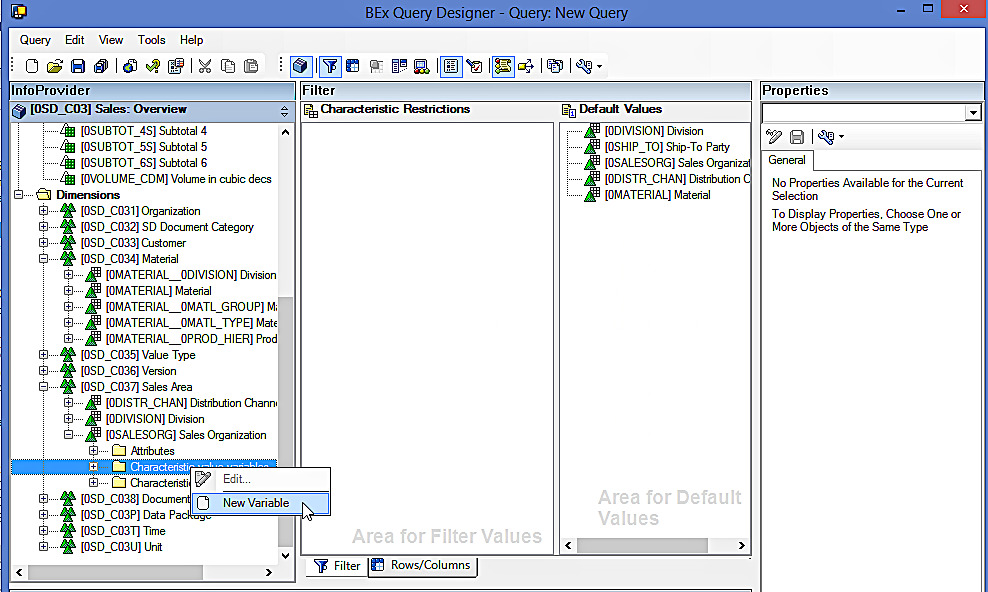
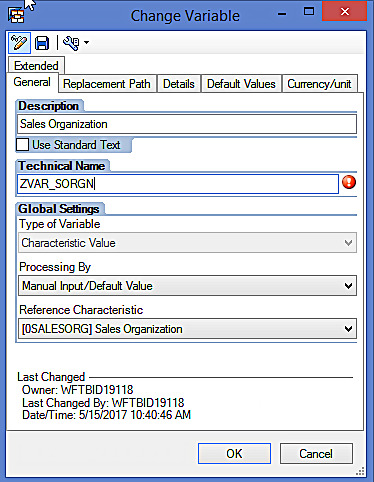
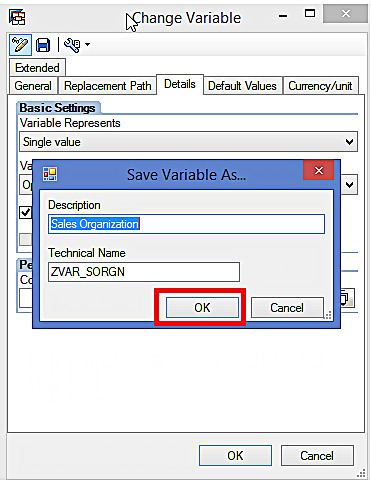
Give an appropriate description and technical name to the variable.
In the Details tab, Select ‘Single Value’ and ‘Optional’ as the variable representation.
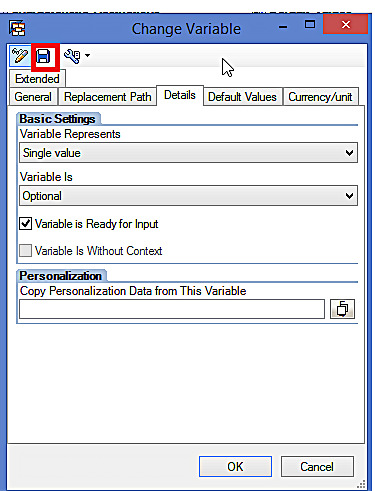
Click on “Save” button highlighted in the above screen and Click “OK” highlighted in the below screen to proceed.
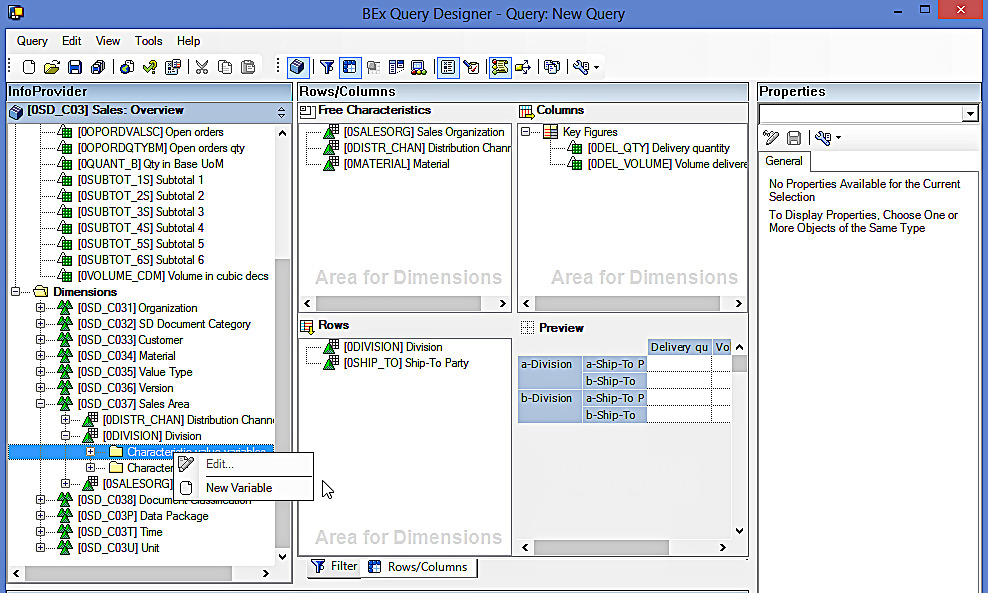
Similarly, Division variable is an optional and multiple values field. The screenshot below shows how the variable is created:
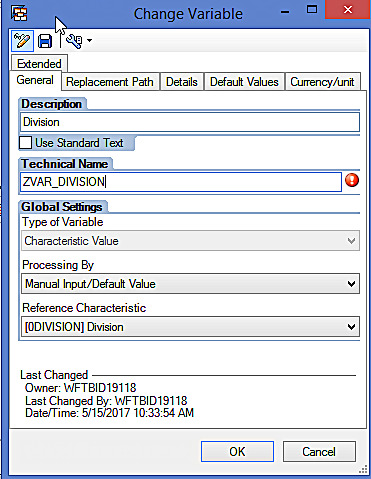
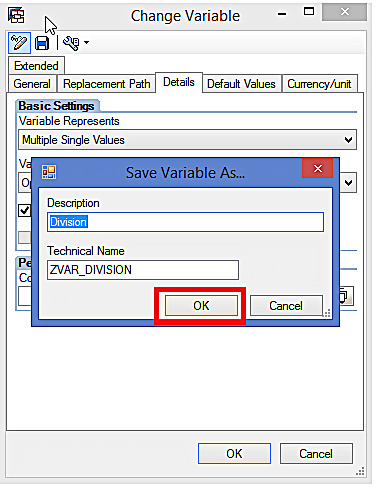
Give an appropriate description and technical name to the variable.
In the Details tab, Select ‘Multiple Single Values’ and ‘Optional’ as the variable representation.
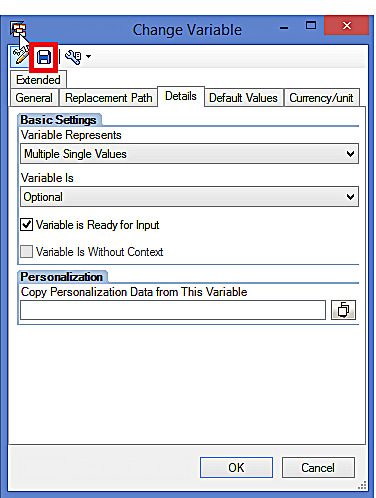
Click on “Save” button highlighted in the above screen and Click “OK” highlighted in the below screen to proceed.
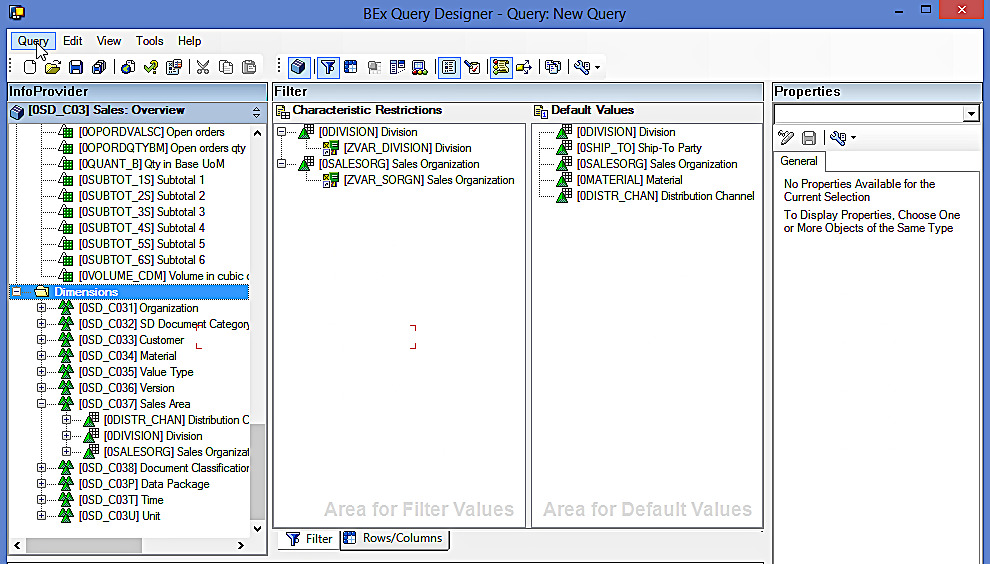
Now, drag and drop these two variables into the filters section.
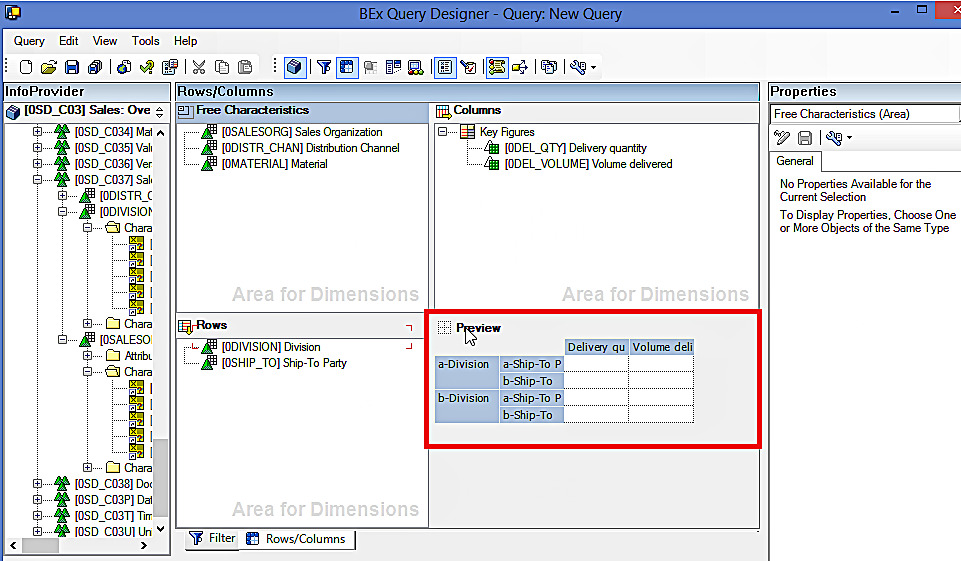
The Preview section shows how the query will look in SAP BEx Analyzer.
The Properties section shows the description, technical name of the characteristics/key figures, along with multiple other features such as Variable Sequence and Value Display.
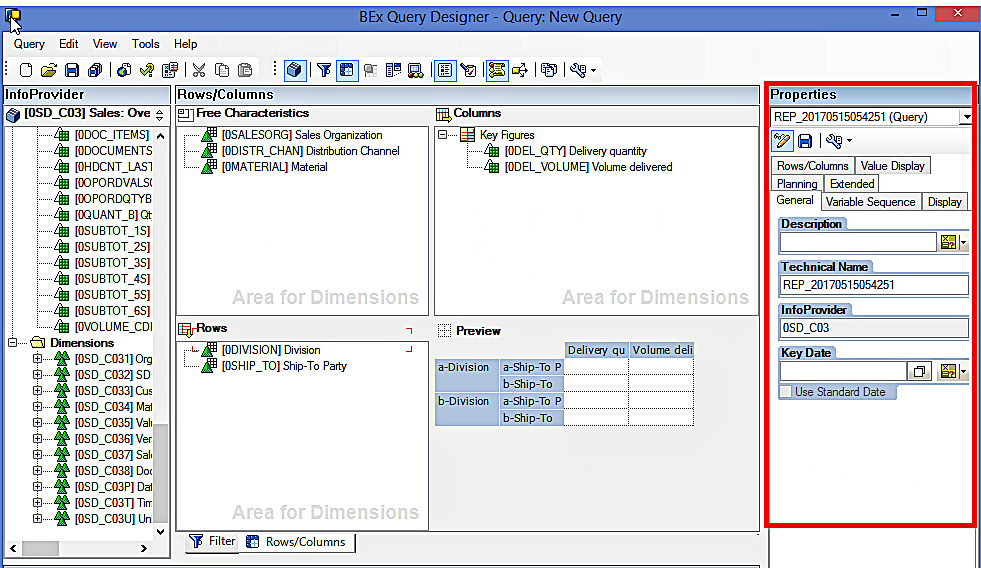
The Variable Sequence shows that Sales Organization and Division variables are not as per the sequence mentioned in the mockup.
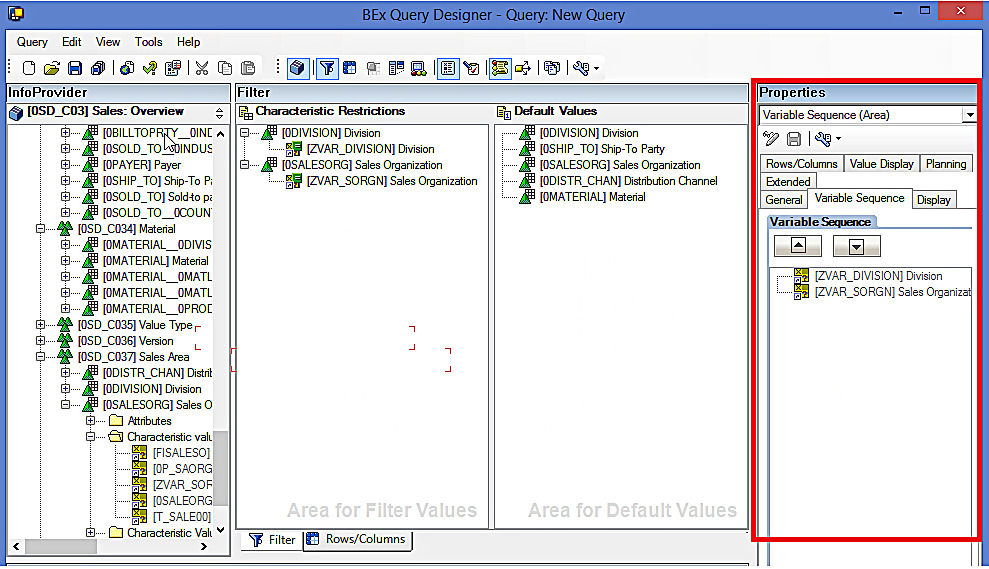
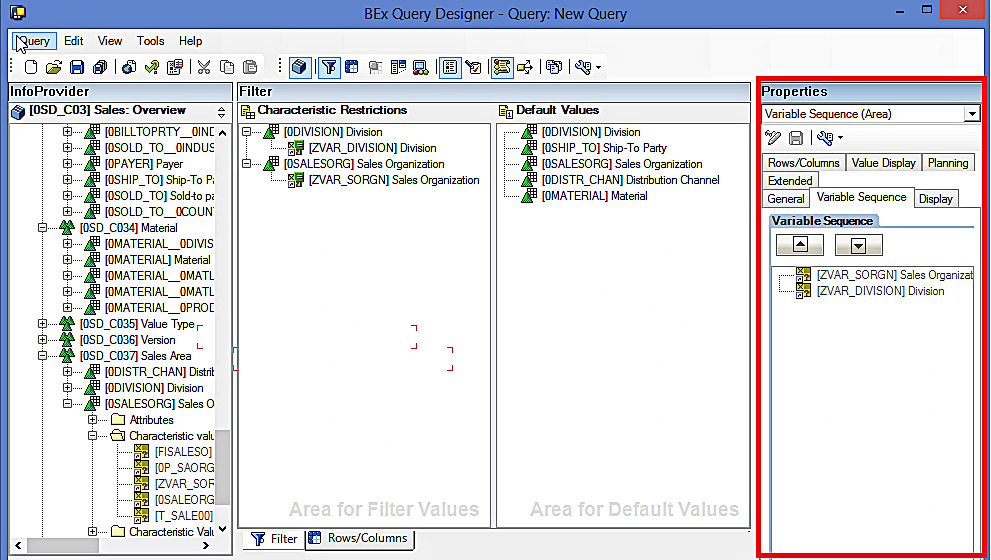
Hence, we will change the variable sequence to match the mockup.
The mockup mentions about the report showing Ship-To Party and Divisions based on Delivery Quantity > 1000. So, we need to define a condition to meet this requirement. The Conditions panel screenshot is show below.

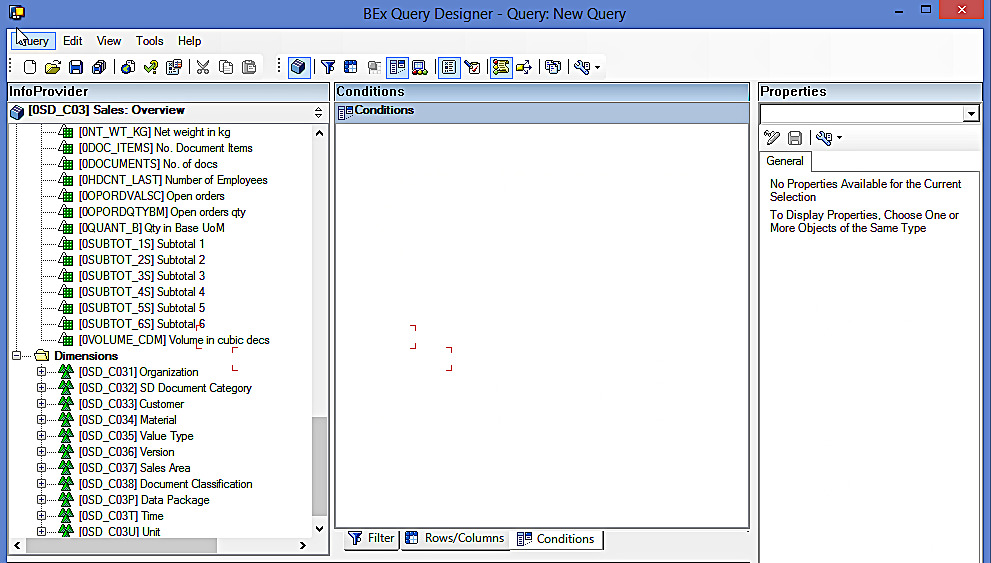
You can right click anywhere inside this pane and click on “New Condition” to create a new condition.
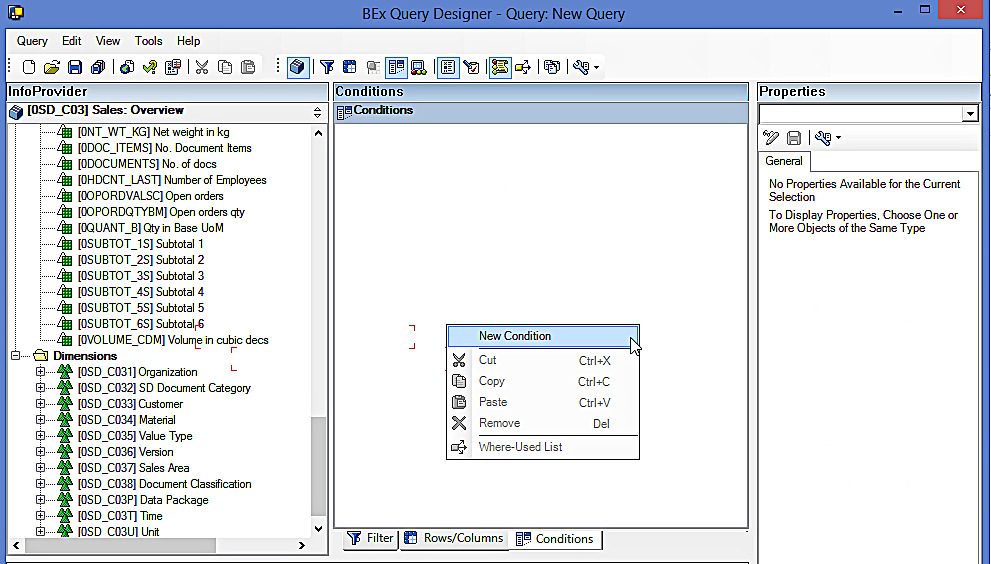
After clicking on New Condition, a new condition will appear as shown below.
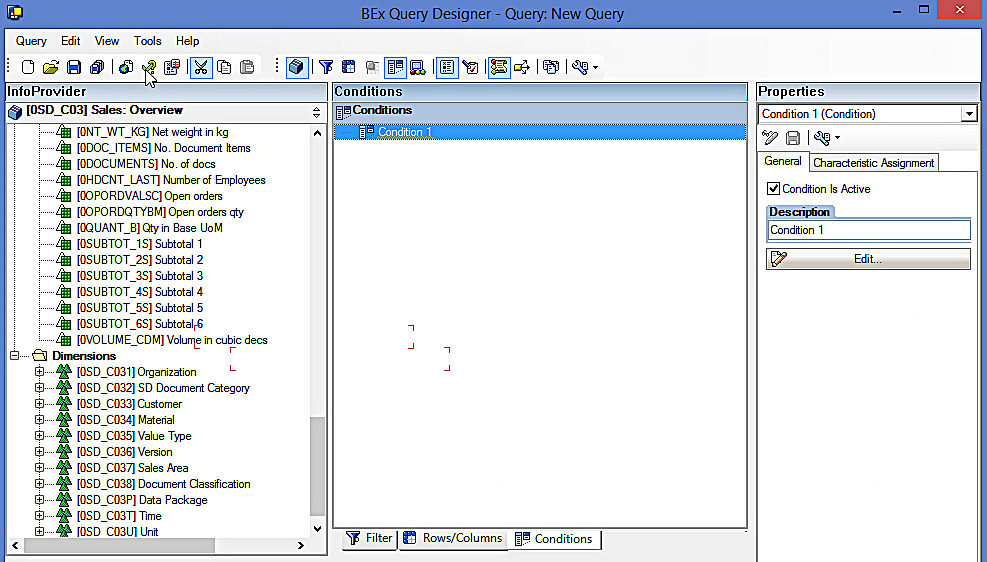
Double-click on the new unassigned condition to define the condition as per the business need.
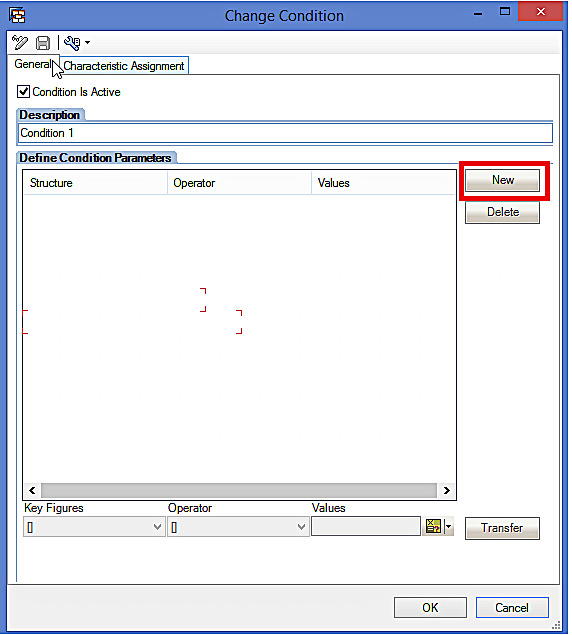
Click on “New” button highlighted in the above screenshot to define the Condition like ranking as per the below screenshot:
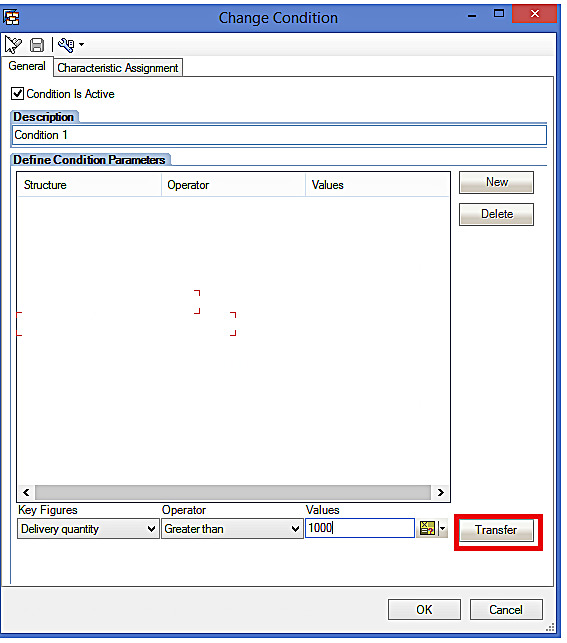
Now, click on the “Transfer” button highlighted in the above screenshot to transfer the condition.
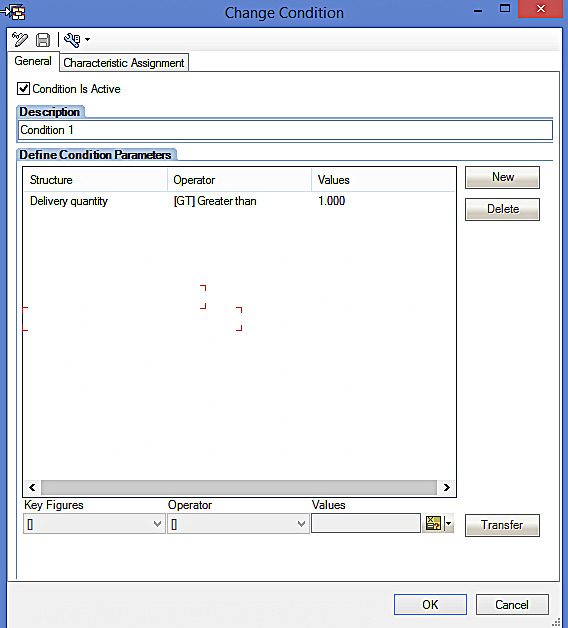
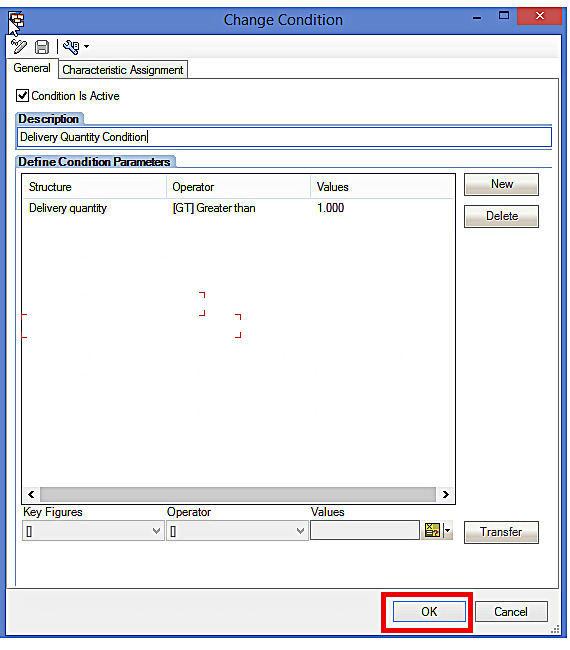
Next, make sure that you give an appropriate description to your condition and click on “OK” to save the condition.
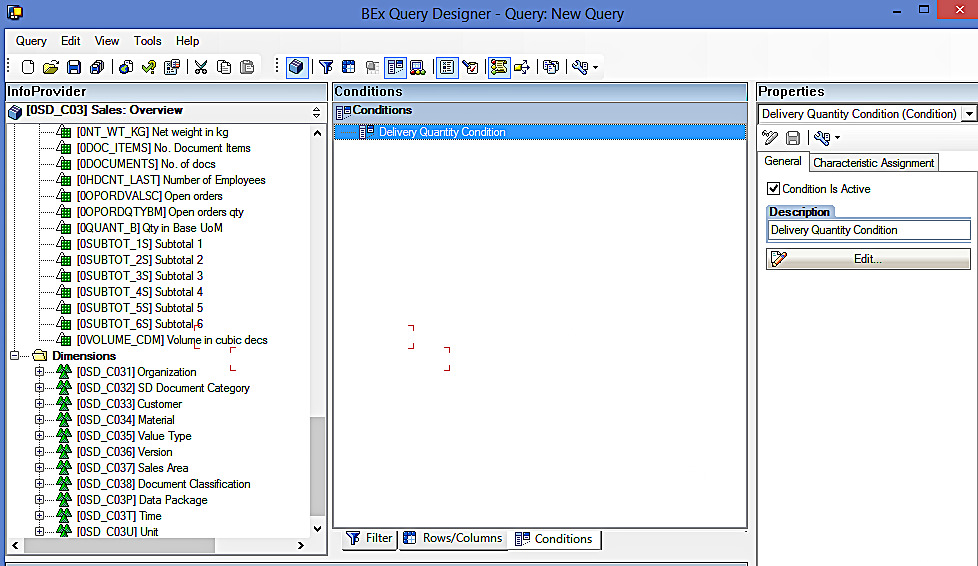
You can see from the below screenshot that the condition has been successfully created.
In addition, the mockup mentions to show alert levels. This can be done by defining Exceptions in SAP BEx Query Designer.
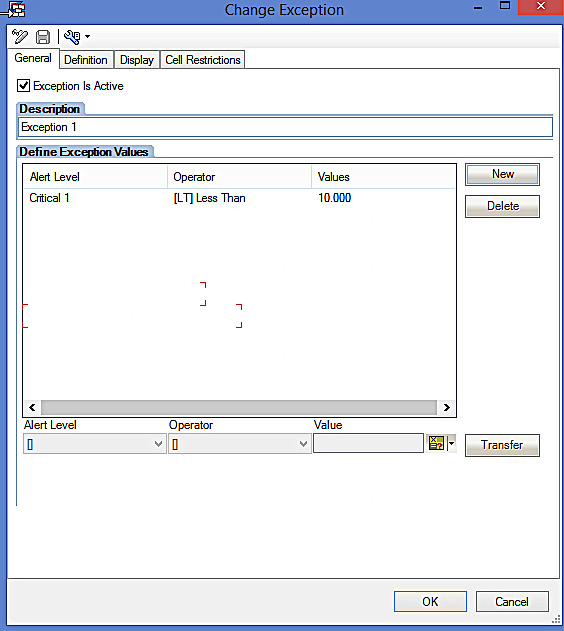
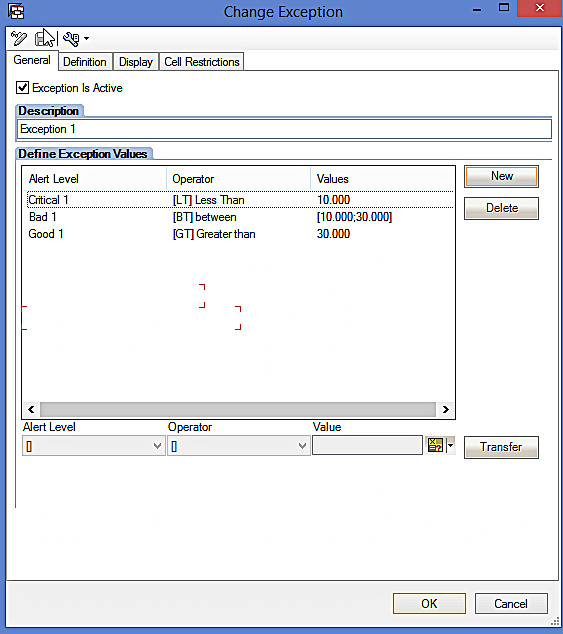
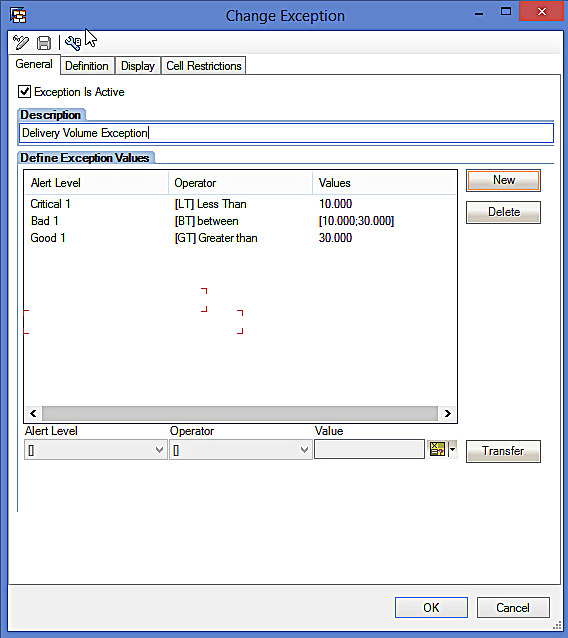
We need to show all the Ship-To Parties and their associated Divisions based on Delivery Volume in a way that Critical range, Bad range and Good range volumes are emphasized in different colors. As per the mockup, Critical range should be less than or equal to than 10,000, bad range to be between 10,000 and 30,000 and good range to be any value above 30,000.
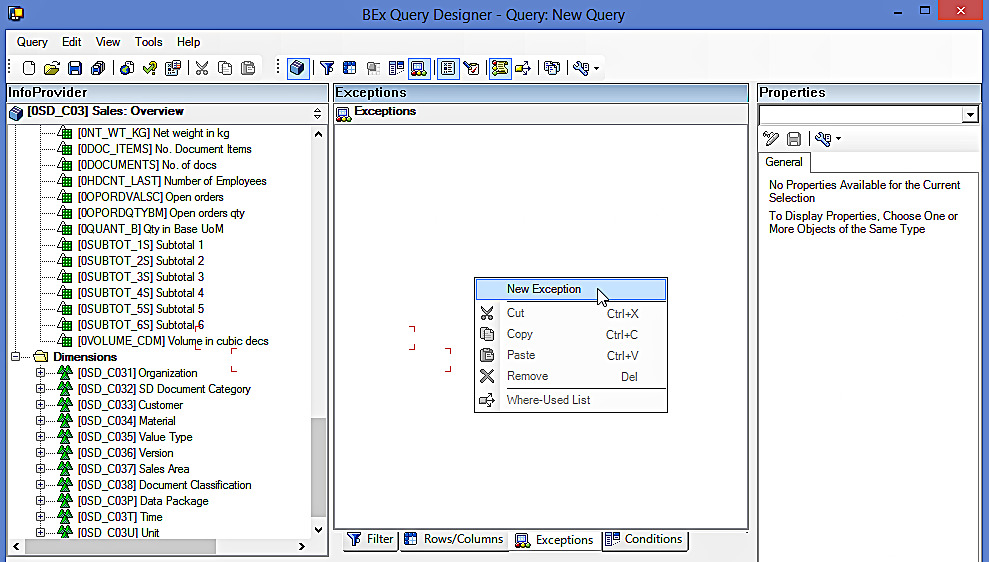
The Exceptions panel screenshot is show below.

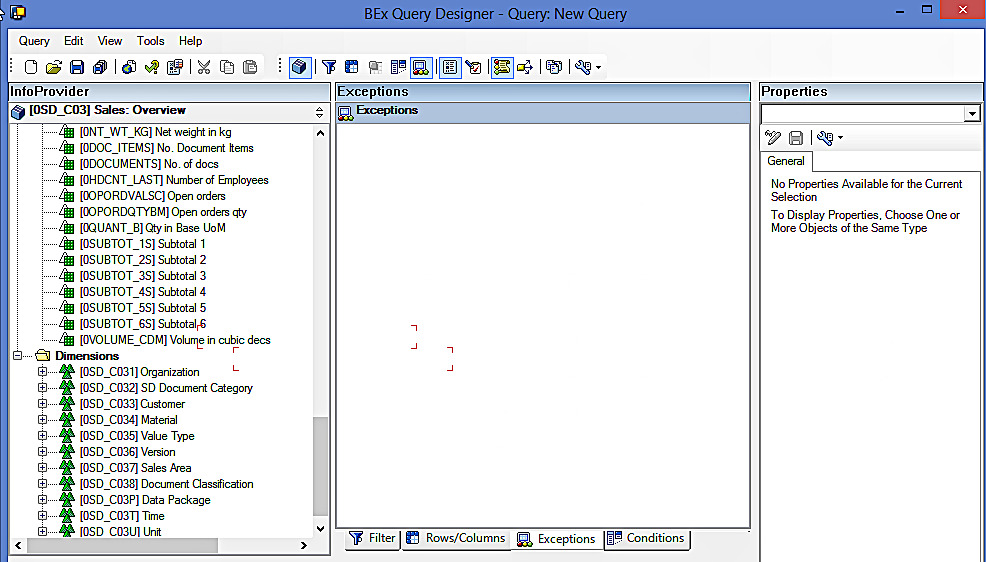
You can right click anywhere inside this pane and click on “New Exception” to create a new exception.
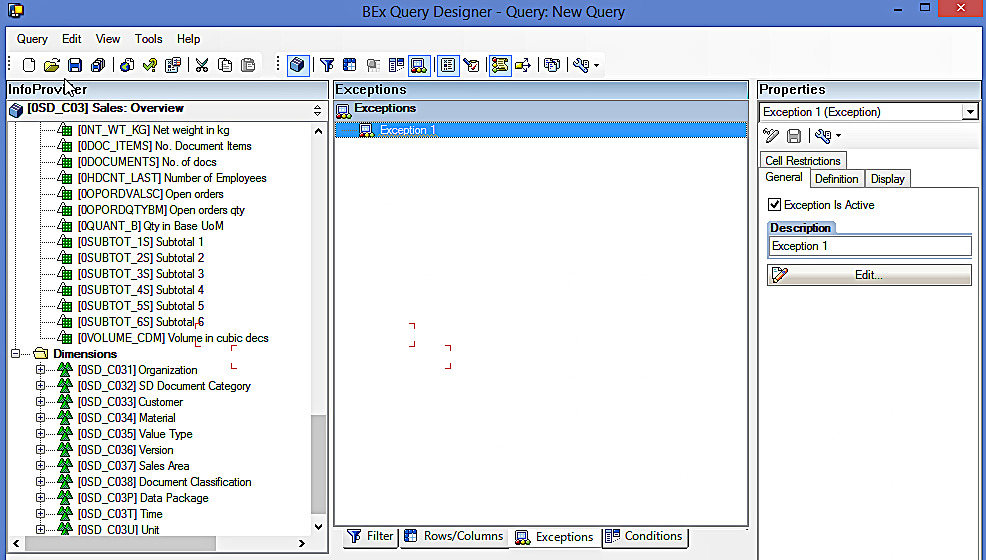
After clicking on New Exception, a new exception will appear as shown below.
Double-click on the new unassigned exception to define the exception as per the business need.
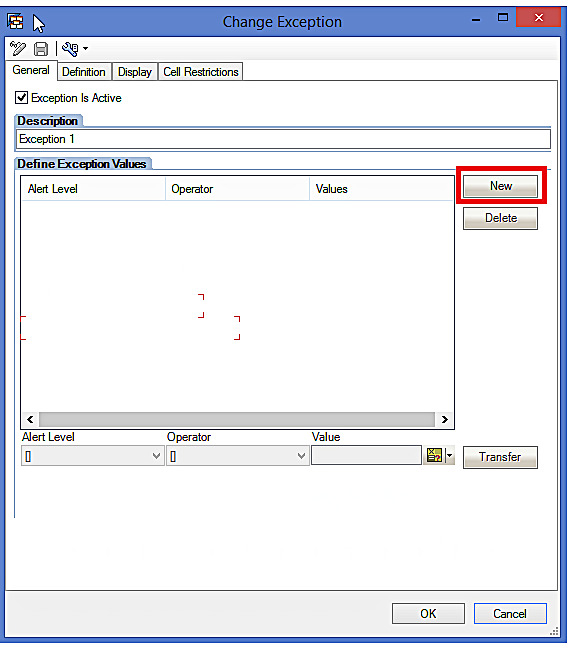
Click on “New” button highlighted in the above screenshot to define the Critical range as per the below screenshot:
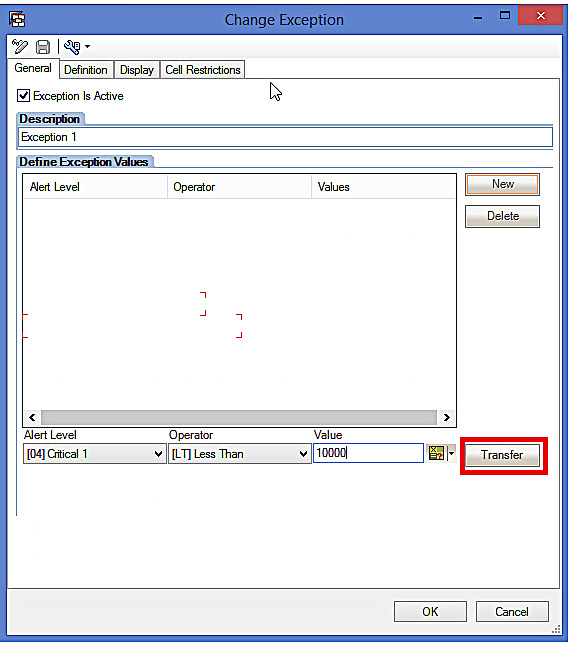
Now, click on the “Transfer” button highlighted in the above screenshot to transfer the Exception.
In the same way, define the other two ranges (Bad Range and Good Range) in a similar fashion to reach the result shown below.
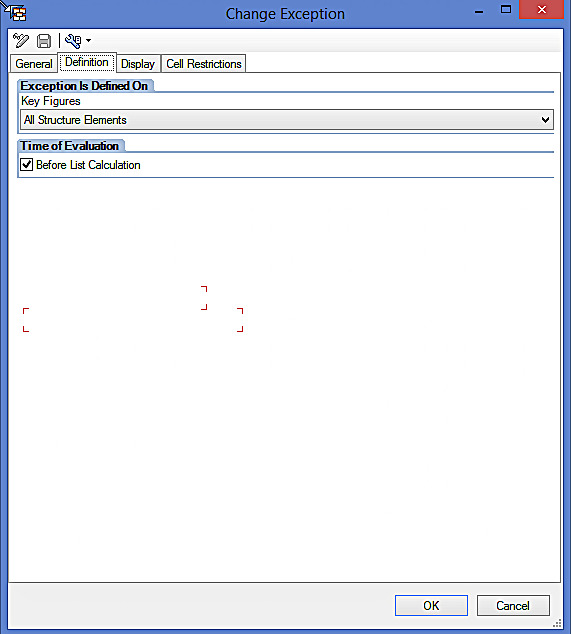
Next, go to the Definition Tab of the above screen. You will see the following screenshot:
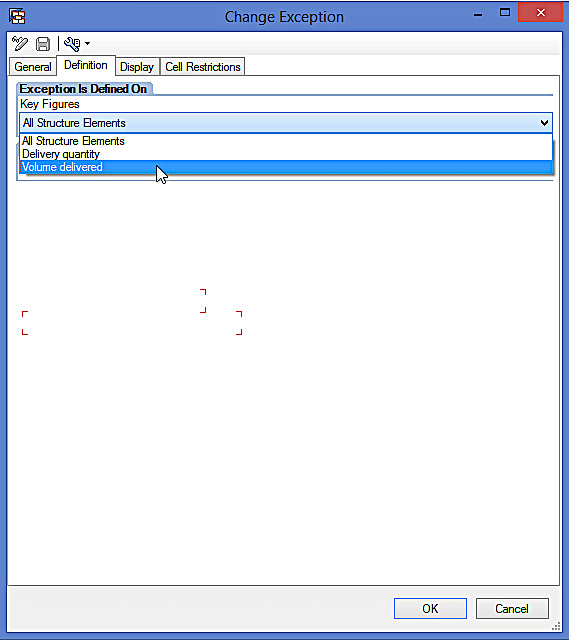
As the mockup shows the exception just on Volume delivered, you have to click on Key Figures drop down and select ‘Volume delivered’ as per the below screenshot:
Now, make sure that you give an appropriate description to your Exception and click on “OK” to save the exception.
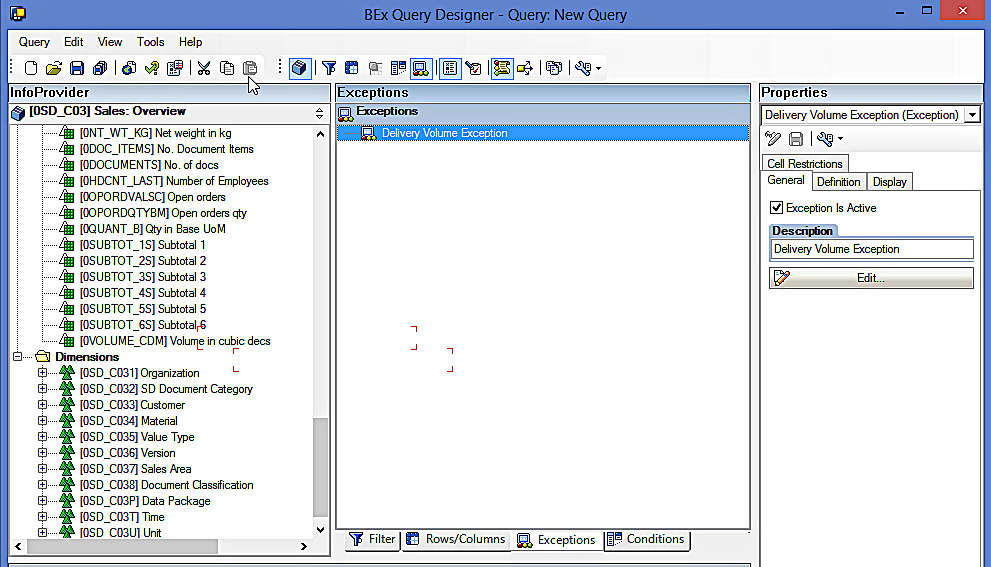
You can see from the below screenshot that the exception has been successfully created.
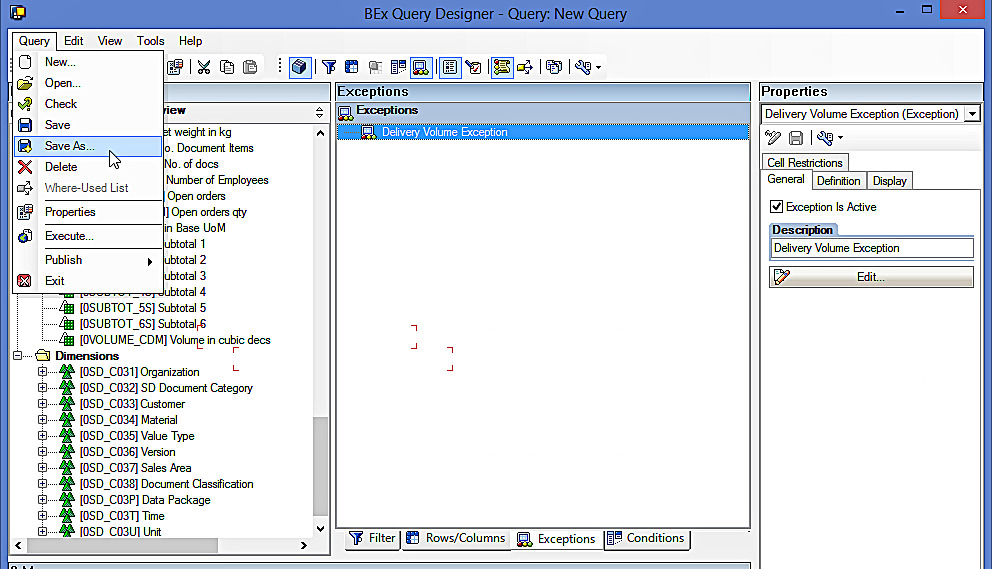
As all components of the query have been created as per the mockup, we will save the query now. As this is a new query, click on “Save As” button available on SAP BEx Query Designer toolbar.
The system prompts you to give the Description and technical name for your query.
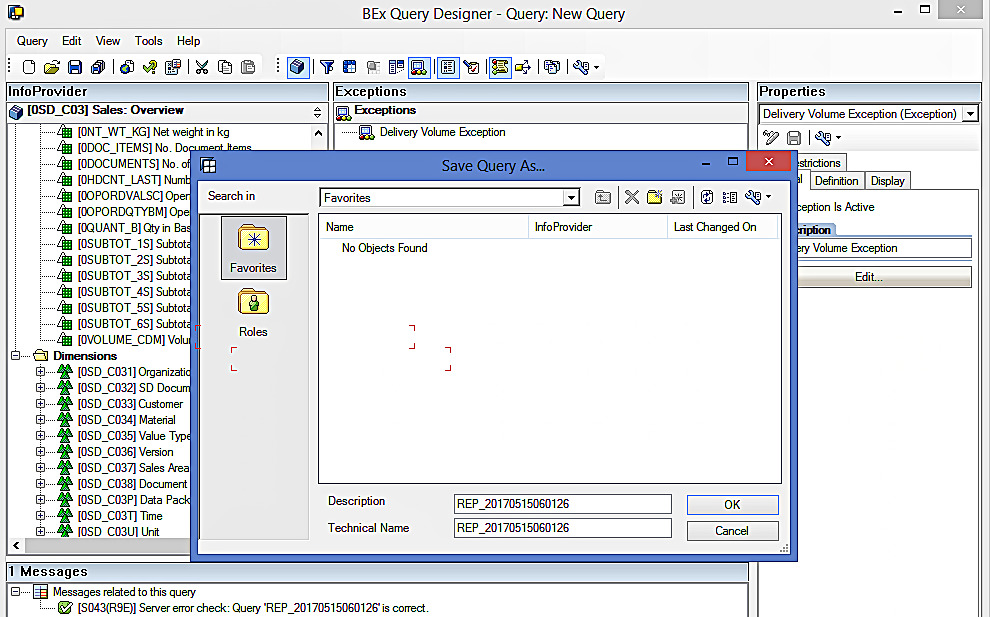
As per the mockup, we will give “Deliveries Overview Report” as the description and “ZSD_DEL_Q001” as Technical name.
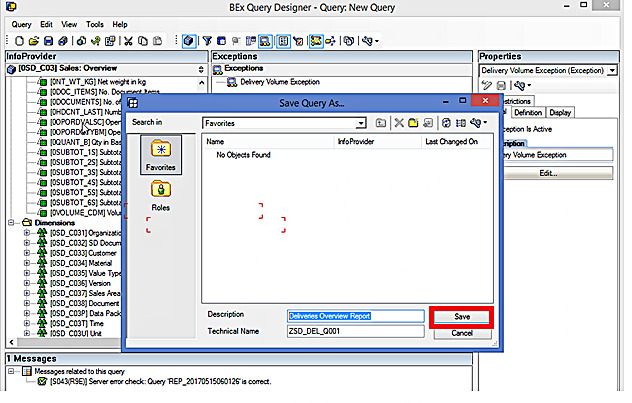
Now, click on “Save” button highlighted in the above screen and the report gets saved.
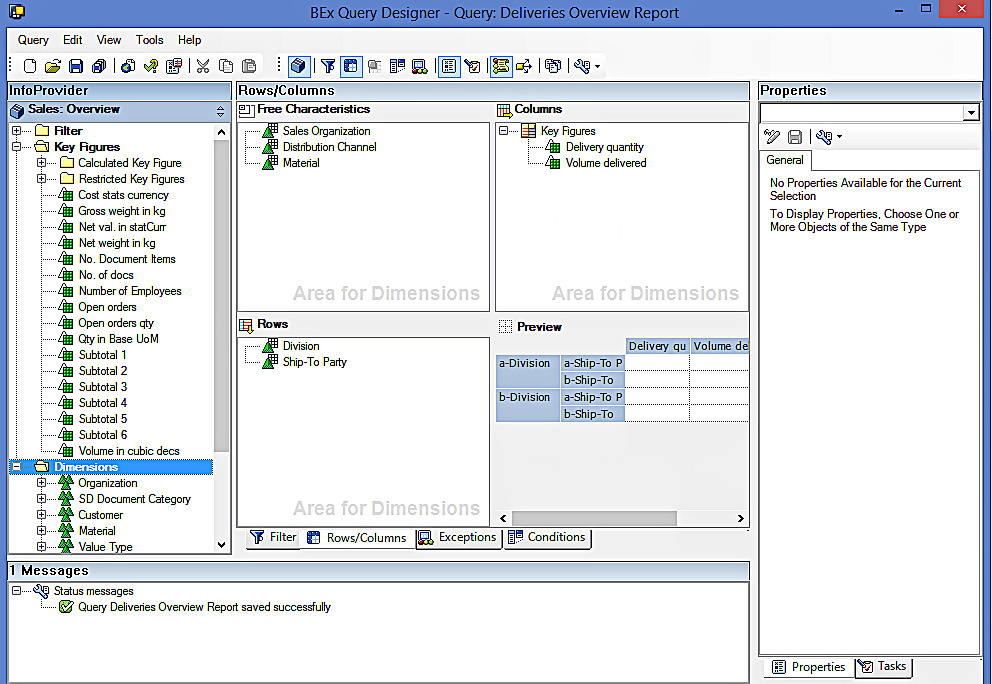
Executing the Query
Open the query “ZSD_DEL_Q001” in BEx Analyzer. This is how it looks like:
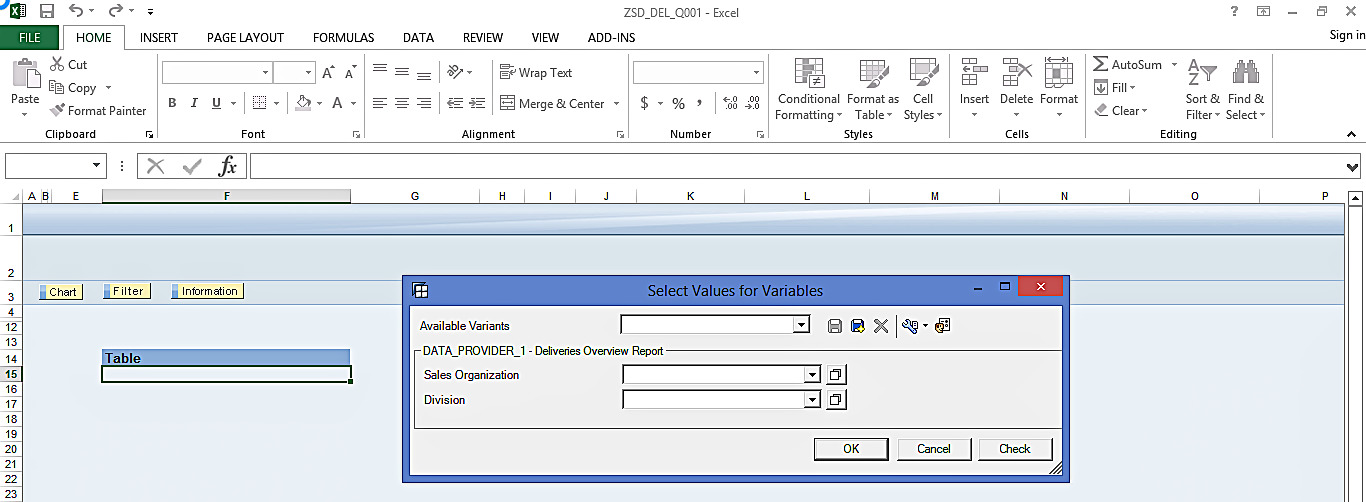
Now, select values for variables and execute the query using the ‘OK’ button.
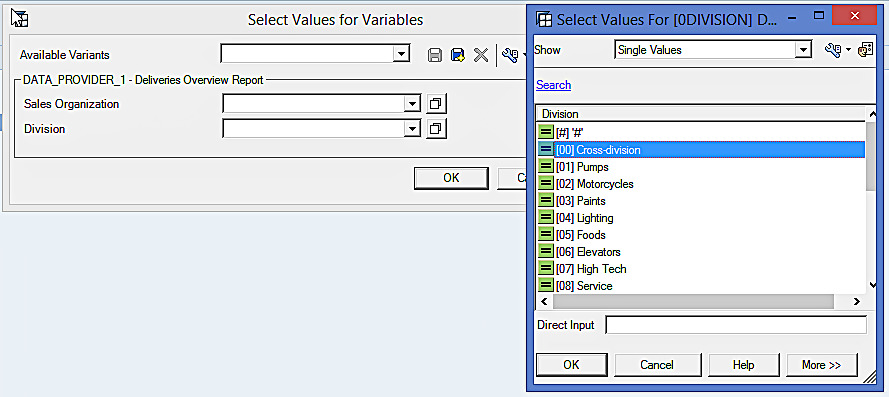

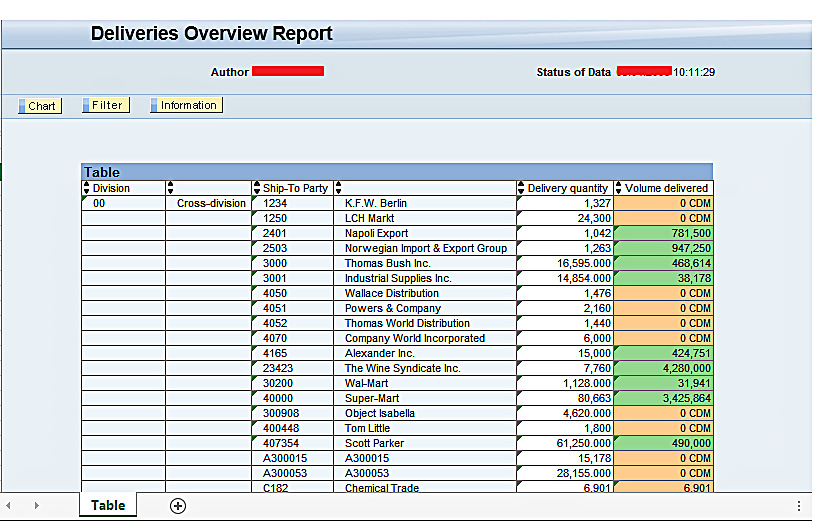
The report output is shown below. This is exactly in line with the report mock-up that was required by the business.
—
Did you like this tutorial? Have any questions or comments? We would love to hear your feedback in the comments section below. It’d be a big help for us, and hopefully it’s something we can address for you in improvement of our free SAP BW tutorials.
Navigation Links
Go to next lesson: SAP BW Hierarchy
Go to previous lesson: SAP BEx Analyzer Overview
Go to overview of the course: SAP BW Training

Very well explained example! Thank you!
Thanks for the clear explanation above. I am able to get a different color using the Exception value or Threshold.
My question is:
How to represent the Exception or Threshold in a graphical way using the BEX Analyzer? I can only see it the Table but not in the Chart.
Gracias,
Jose