
 In this SAP BW tutorial, we will talk about SAP Calculated Key Figures. You will learn what SAP Calculated Key Figures are and how to use them in Query Designer for reporting. This tutorial is part of our free SAP BW course.
SAP Calculated Key Figures
Whenever we talk about SAP Key Figures, we should know that there are three different types of Key Figures:
- Basic Key Figures
- Restricted Key Figures
- Calculated Key Figures
Here we will talk about SAP Calculated Key Figures.
Definition
As the name itself suggests, in certain cases key figures cannot stored in an InfoProvider. In this case, will create a Key Figure with some Calculations in Query Designer.
These Key Figures are executed at run time. For example, if in the InfoProvider we have Sales, Material, Customer, Quantity and Revenue figures but, in the report, we want to see Tax, then should use SAP Calculated Key Figures.
Suppose that Tax = 10% of Revenue. We can store this information in the InfoProvider. But what if in the future the Tax percentage changes according to year and then it will be difficult to enter these changes. Because today our tax percentage is 10% but tomorrow it might change. Imagine that for June 2013 we want to calculate Tax and it is only 10%. Then, later in 2014 it was increased to 20%.
Can we think here that can we go back to the InfoProvider and load entire data according to these changes? The answer is NO. It is very difficult and most time-consuming process.
Here some kind of calculations is involved (for getting the tax figure) but these calculations cannot be performed automatically in the InfoProvider. In this scenario, SAP Calculated Key Figures are very useful.
SAP Calculated Key Figures comes into picture whenever we want to generate a formula and derive a value. It is easy to load the entire dataset according to these changes. Whenever there is involvement of calculations, where the calculations cannot be performed and stored in InfoProvider.
SAP Calculated Key Figures can be executed and performed until all data gets into screen. We can create a variable for a calculated key figure rather than giving hard code. We can use these variables dynamically.
Now will see how to create SAP Calculated Key Figures.
Create New Query for Calculated Key Figure in Query Designer
So, we have Sales data and want to see Tax for each associated record in the report. Here, Tax = 10% of Revenue (REV * 0.1). So, for that we have to create a New Formula for Tax calculation.
Here are the steps to create a Calculated Key Figure.
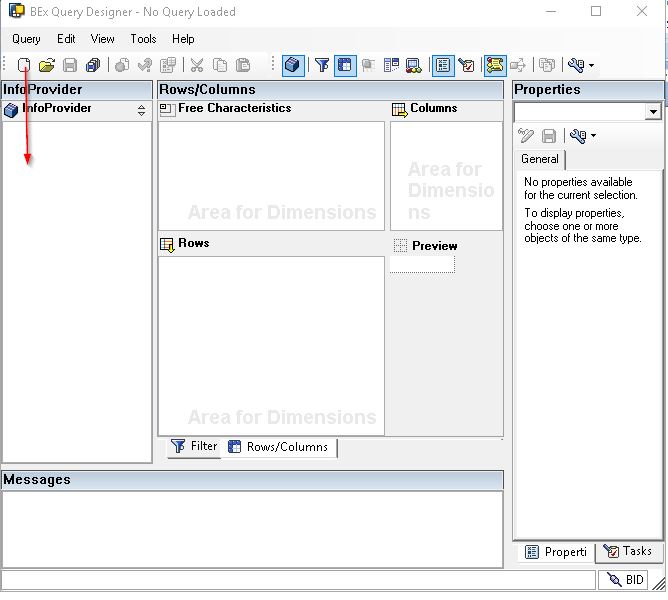
Step 1: Open Query Designer from All Programs.
Then, it will open Query Designer screen.
Step 2: Create a new query by selecting New Query as shown in the below image.
Step 3: Select required InfoCube from InfoArea path or you can select from history also if you used one recently.
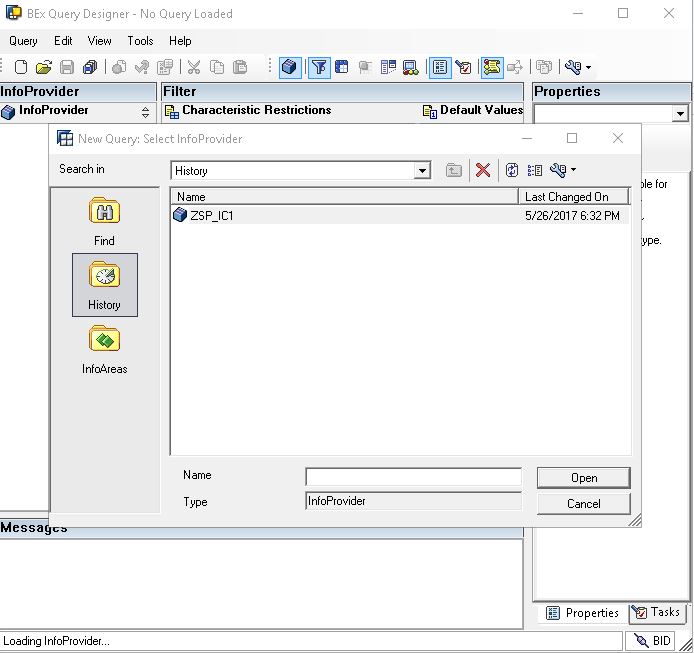
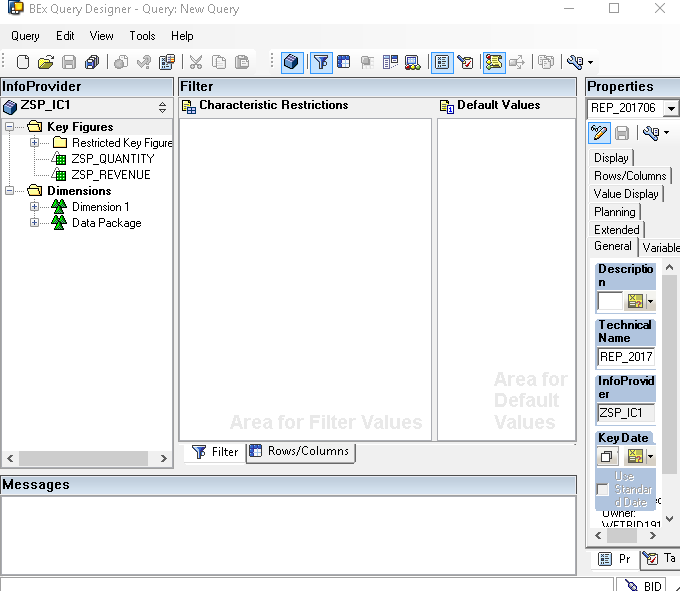
Next, click OK. Then, you will get a Query Designer screen with all the InfoObjects which are in the InfoCube.
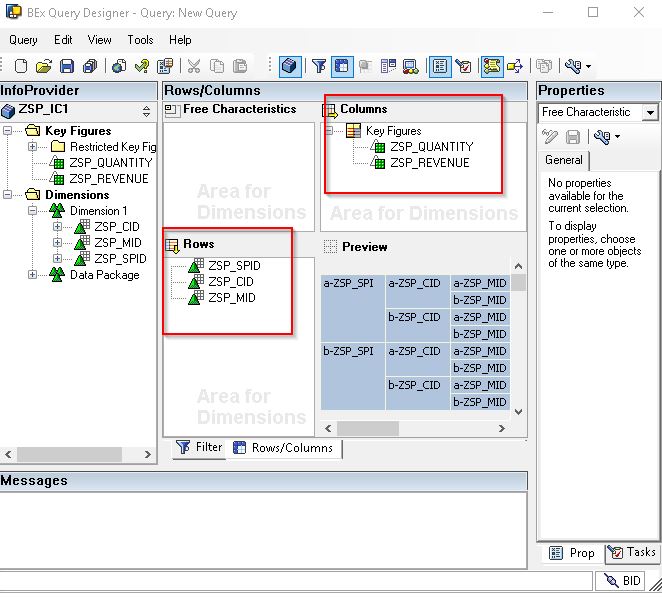
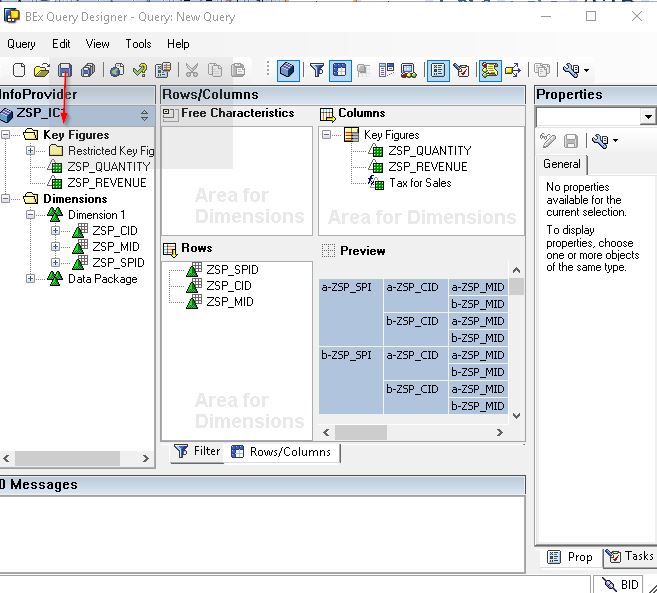
Step 4: Now drag and drop characteristics to Rows and Key Figures to Columns on the right hand side.
ZSP_SPID, ZSP_CID (CUSTOMER), ZSP_MID (MATERIAL) to Rows
ZSP_QUANTITY, ZSP_REVENUE to Columns
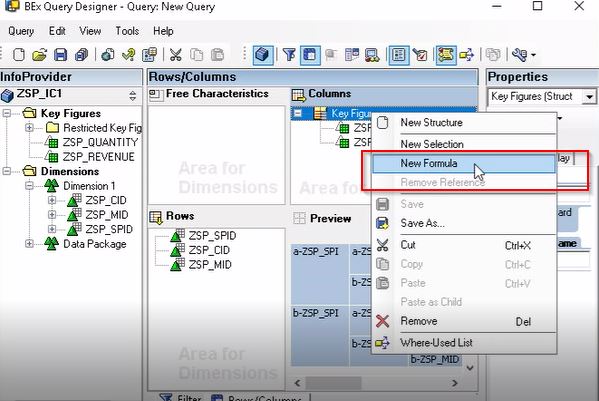
Step 5: Select Key Figures, then right click and select New Formula to create a calculated key figure.
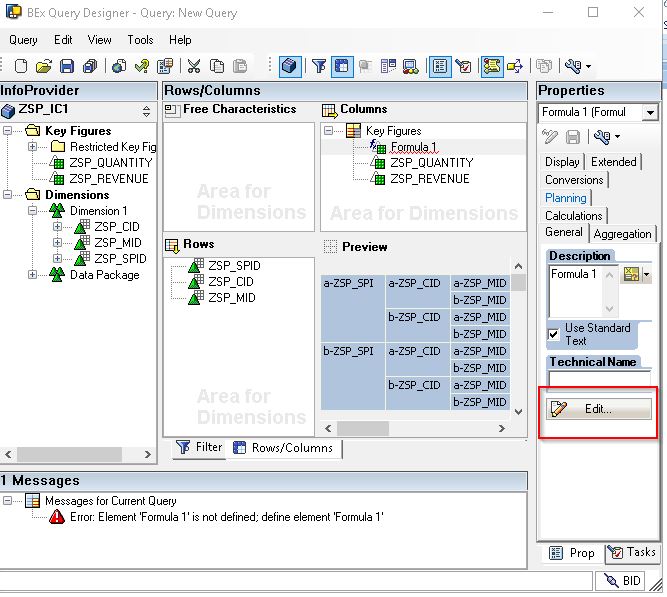
Step 6: After selecting it will create a formula and we have to edit the details with appropriate naming and formula. For that click on Edit button.
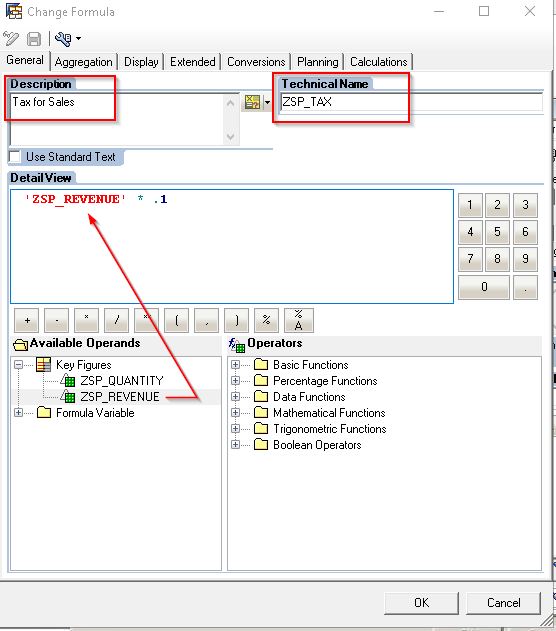
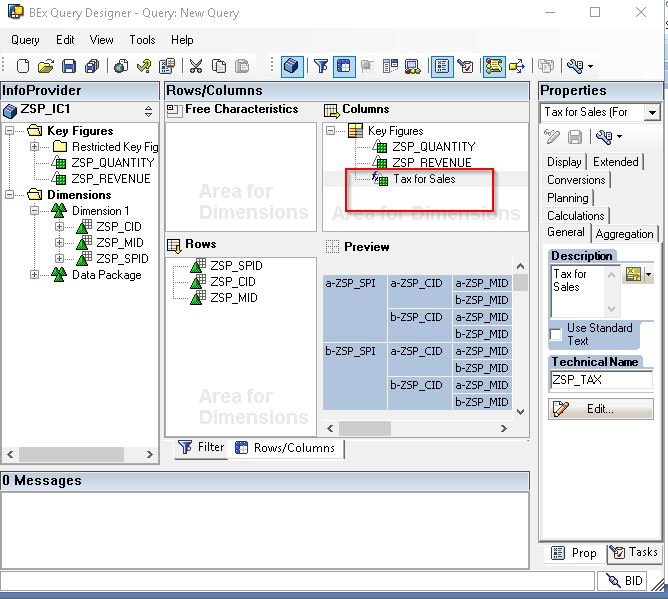
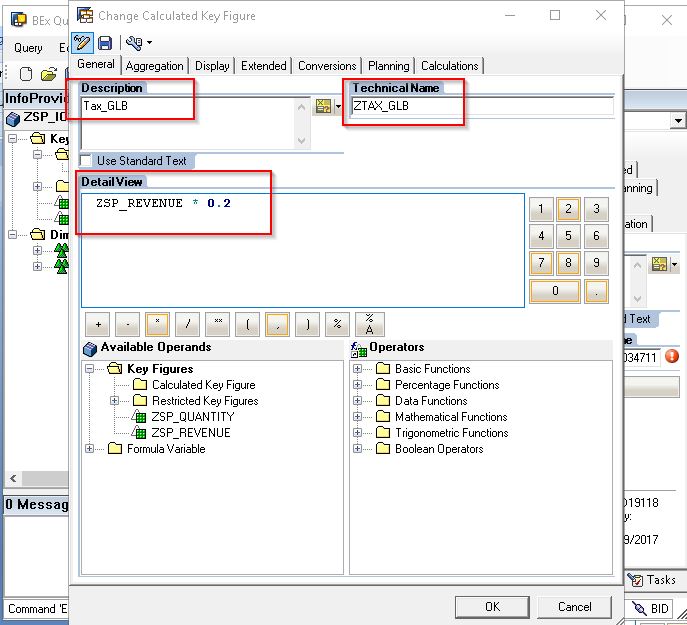
Step 7: It will popup a window to provide Description, Technical name and to write formula in Detail View.
Description: Tax for Sales
Tech name: ZSP_TAX
FORMULA: ZSP_REVENUE (we can drag Revenue from Key Figures) * 0.1 (as it is 10%)
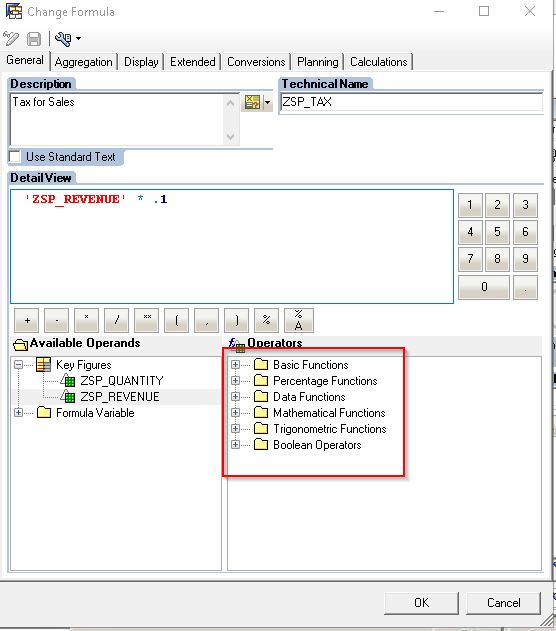
Next, click OK. Other than basic functions we can also use other various functions in our formulas. Those are Basic, Mathematical, Percentage, Data, Boolean, etc.
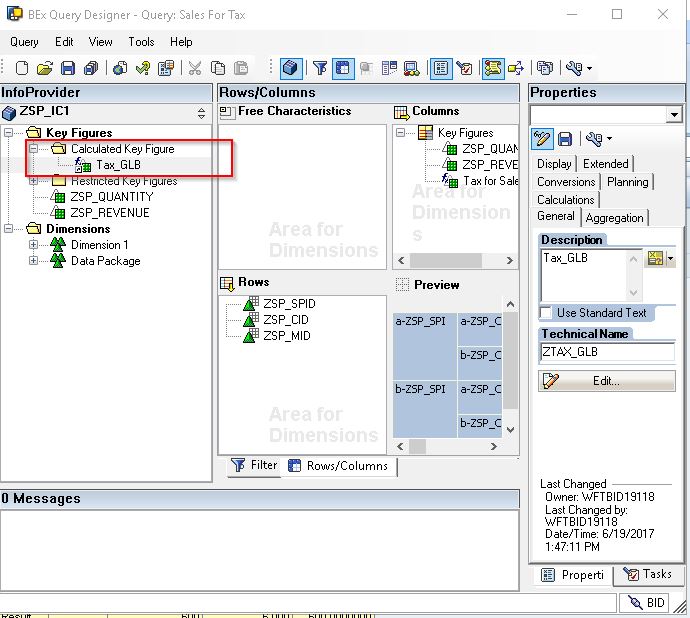
Step 8: Here you can see that Calculated Key Figure is created in the Columns, i.e., Tax for Sales.

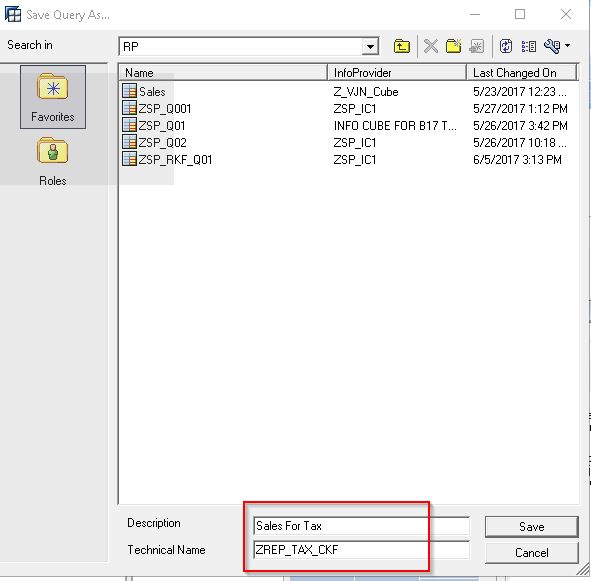
Step 9: Now, save the query.
Step 10: After clicking Save button, it will popup a window to give query name in your selected folder.
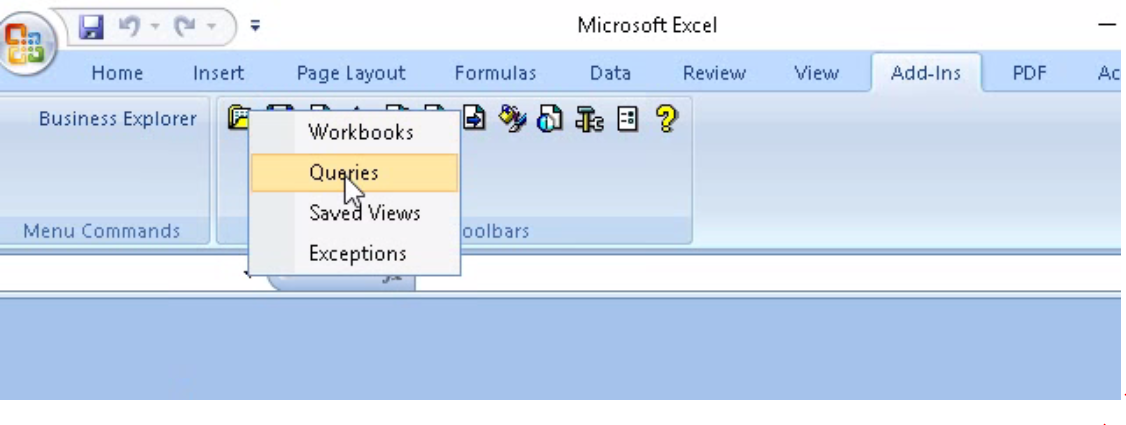
After completion of saving the query, run a report by opening BEx Analyzer. In BEx Analyzer, navigate to the following menu:
Add-Ins -> Business Explorer -> Open -> Queries
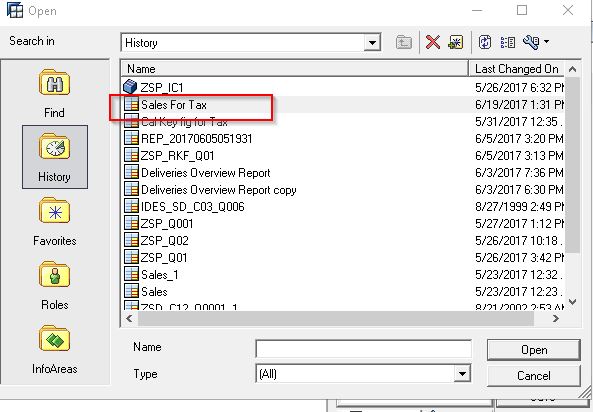
It will ask for query which we want to run. Select the previously created query then click OK.
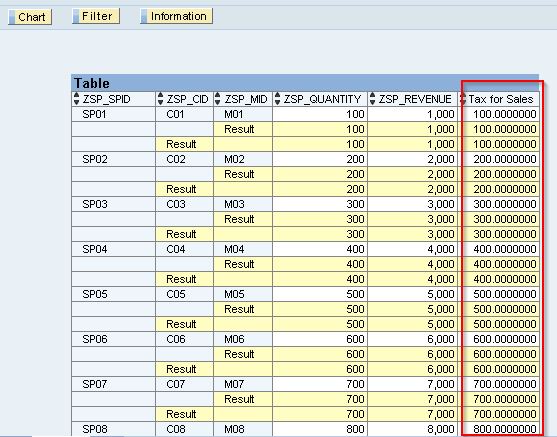
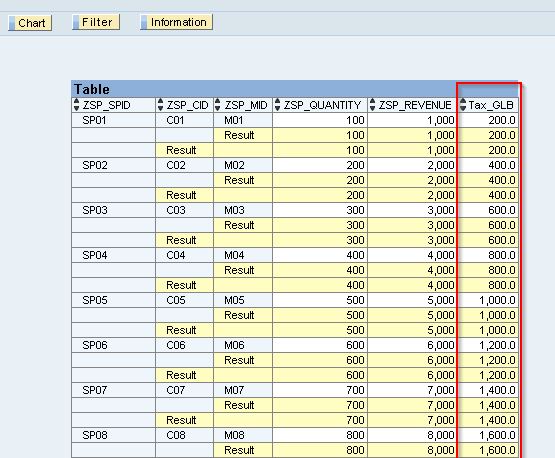
Below is shown the output of the report. It created a new column with the calculated key figure (ZSP_TAX) and got the Tax data for 10% of Revenue.
SAP Calculated Key Figures can be created in two ways:
1. Local objects
2. Global objects
Local Objects
Local Objects are the objects which are available to a specific query only. These objects are not available for other queries. Whatever we did till now (created ZSP_TAX Calculated Key Figure) is called Local Object.
If we want to use the same Calculated Key Figure in other queries for this InfoProvider, it’s will not be possible. That’s why it’s called a Local Object.
Global Objects
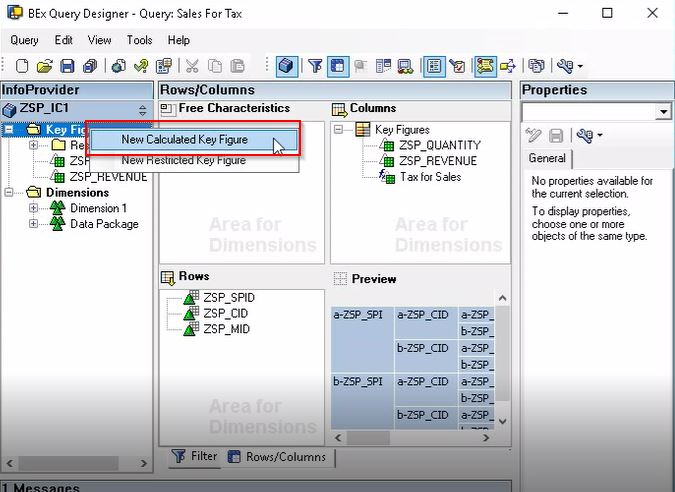
Global Objects are defined as the objects which we can used in other queries under the same InfoProvider. If we create a Global Calculated Key Figure, then we can also use this in other queries. To create a Global Calculated Key Figure, go to the left-hand side of Query Designer screen.
Step 1: Select Key Figures, then right click and select New Calculated Key Figure.
After clicking this option, the system will create a new formula and you should click Edit button on right-hand side.
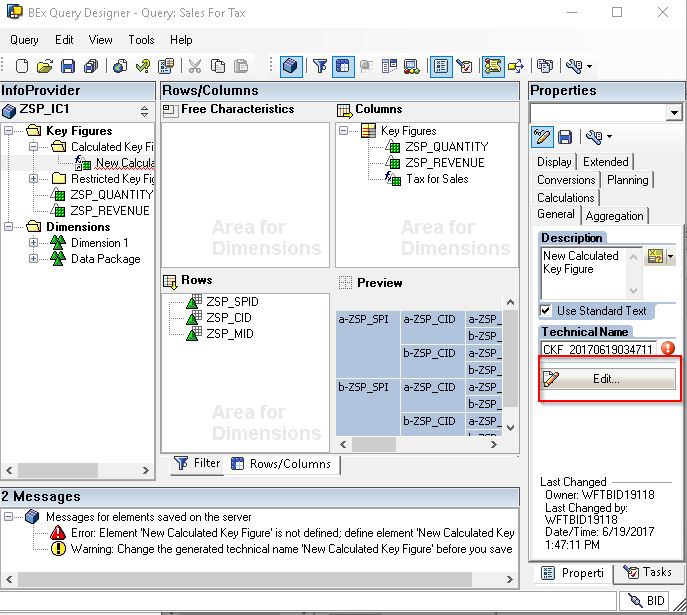
Then enter Description, Technical name and write a formula. Here we can change Tax for this Global Calculated Key Figure to 20%.
Once we are done with these details, click OK. Now, the system will create a Global Calculated Key Figure on left-hand side.
Finally, save the query and open Analyzer to run the report.
—
Did you like this tutorial? Have any questions or comments? We would love to hear your feedback in the comments section below. It’d be a big help for us, and hopefully it’s something we can address for you in improvement of our free SAP BW tutorials.
Navigation Links
Go to next lesson: SAP Key Figures Properties
Go to previous lesson: SAP Restricted Key Figures
Go to overview of the course: SAP BW Training