 Welcome to SAP BW tutorial where we will talk about SAP Key Figures Properties. You will learn how to configure various settings for the key figures and how to use them in Query Designer for reporting. This tutorial is part of our free SAP BW course.
SAP Key Figures Properties
Key Figure
Key figure is an info object which is defined as a measurable object. It has the data that is of numerical type like quantity, revenue, weight, etc. We’ve already discussed restricted key figures and calculated key figures in our previous tutorials.
SAP Key Figures Properties
SAP key figures properties are used to configure various settings for a selected key figure. They enable us to determine how the key figure works and how it is displayed in a query result (report).
Here, we will look at different properties for key figure query elements. The properties screen for a key figure shows seven different tabs:
- General
- Aggregation
- Display
- Conversions
- Planning
- Extended
- Calculations

General Tab
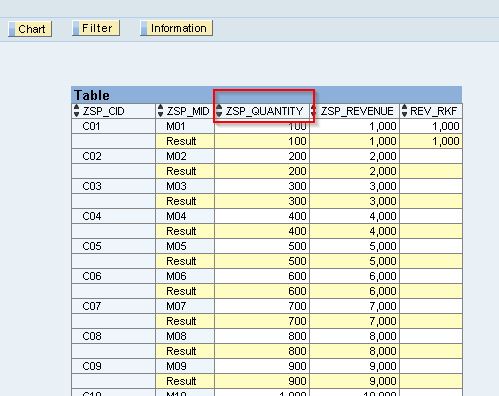
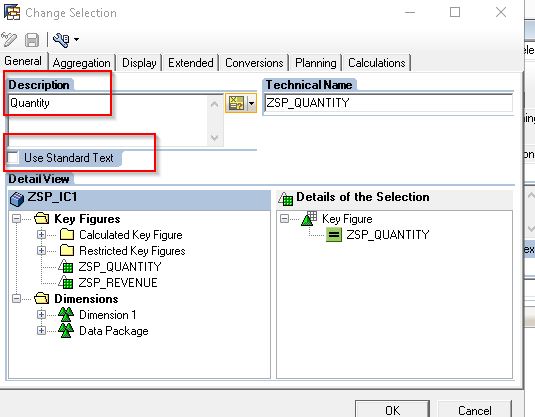
Here we maintain description and technical name for the key figure. The description which we maintain here is displayed in the report. If we want to keep the default description that is coming from InfoProvider, then we can select “Use Standard Text” checkbox.
For example, in the below image we can see that the default description is displayed.
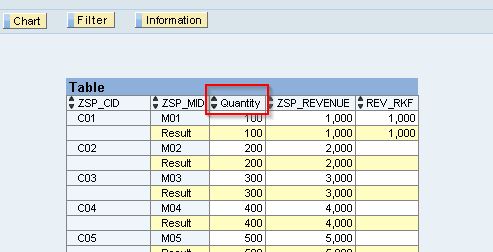
If we want to see other than default description in the report, we can change it at this tab.
A report with the new description is shown below.
Display Tab
Here we can control the display related settings of the key figure values in the query output and have different option available on the Display tab.
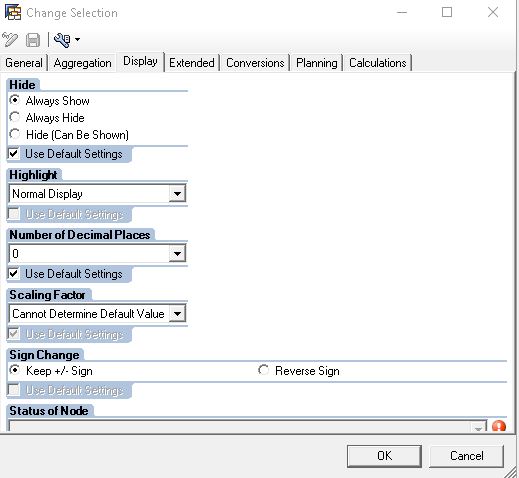
The following SAP key figures properties are available on the Display tab.
Hide
Hide key figures is useful when you only need to calculate formulas and do not want to display in the report. Select “Hide (Can Be Shown)”, so that users can select the key figure in the navigation controls to display the key figure in the report.
Highlight
Choose whether the key figure is to be highlighted in the report. This allows the presentation tool to identify the key figures and apply additional formatting so that the values are clearly shown in the report.
Number of Decimal Places
We use this option to specify the number of decimal places to be displayed. For example, 0 or 0.0 or 0.00 or 0.000.
Scaling Factor
We set the scaling factor to improve the presentation of the key figure when we have large numbers in our results. For example, 1 or 10 or 100 or 1,000 or 10,000. If key figure’s value is 5,000 (e.g., revenue = 5,000) and we set scaling factor = 1,000, then the report will display it as revenue = 5.
Sign Change
Here we can change the default sign for the key figure. +/- sign is only a display function and has no influence on formula calculations.
Aggregation Tab
On this tab, we choose how the formula result is calculated (other than SUM) by selecting one of the options in the drop-down list. For example, min or max or count, etc. We must also select the reference object.
If you open the Aggregation tab for the key figure in our example, this property will be in disabled mode.
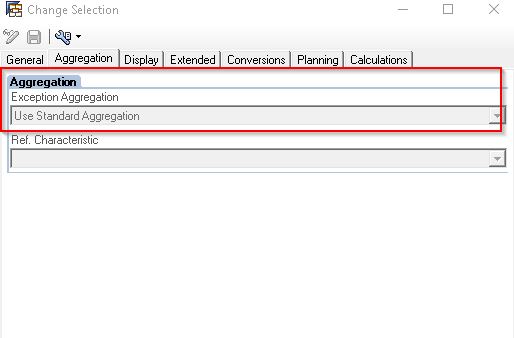
As it is a basic key figure and that is coming directly from the InfoProvider, so that is why this property is disabled.
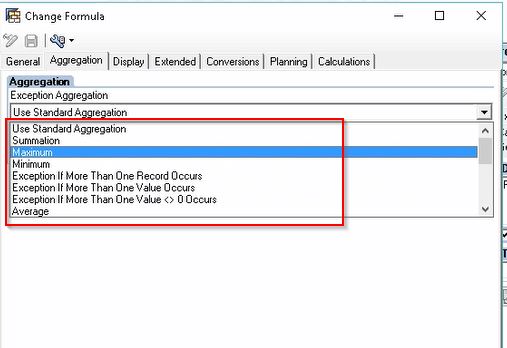
Let’s create another formula key figure and then we will be able to use this tab. We can select max, min, count, etc. If we scroll down, we have so many options to use for this exception aggregation.
Conversions Tab
The two types of key figure conversions are present here. First, we have Unit Conversion. This conversion type is useful for the key figures with units that have different UOM (Units of Measures). For example, to change from Grams to Kilograms. When we want to deal with UNIT conversions in the backend we have one table T006 where all UNITS are maintained.
In SAP ECC, all unit conversions are maintained in T006 table and we have to replicate this ECC T006 table to BW T006 table. For unit conversion, first we will create a conversion type. The transaction code for creating a conversion type is RSUOM. If we want to define a conversion, we need to specify what is a source unit and what is a target unit. Here, source unit is Grams and target unit is Kilograms.
To create conversion type perform the following steps.
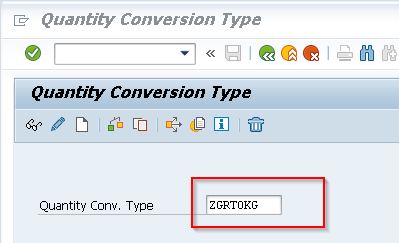
Step 1: Go to transaction RSUOM.
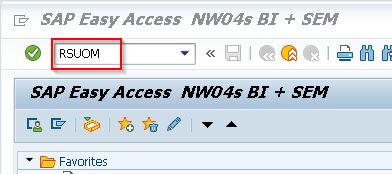
Step 2: Then, opens Quantity Conversion Type screen. Here, give a proper name as shown in the below image and click create button.
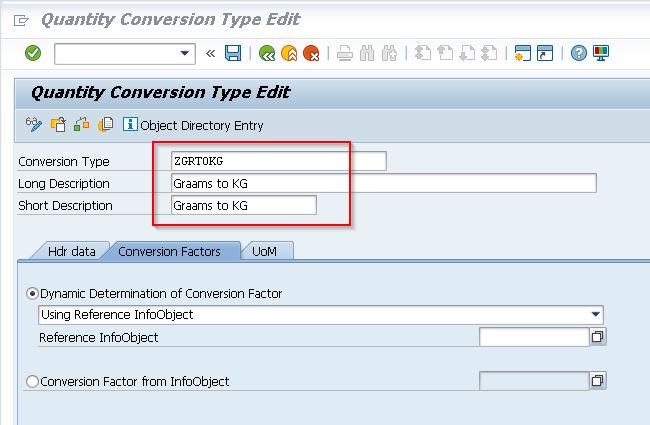
Step 3: Enter Long Description and Short Description.
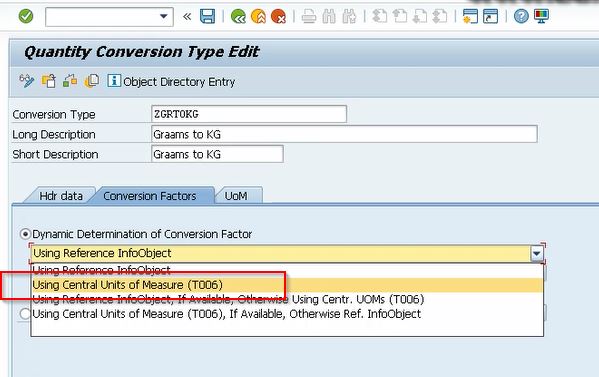
Step 4: In Conversion Factors tab, select ‘Dynamic Determination of Conversion’ factor. Here, when you scroll down you can see some options. You should select ‘Using Central Units of Measure (T006)’.
Step 5: Next go to UoM tab. Select the first option as ‘Unit of Measure from DataRecord’ and target unit of measure as ‘Fixed Unit of Measure’ equal to KG.
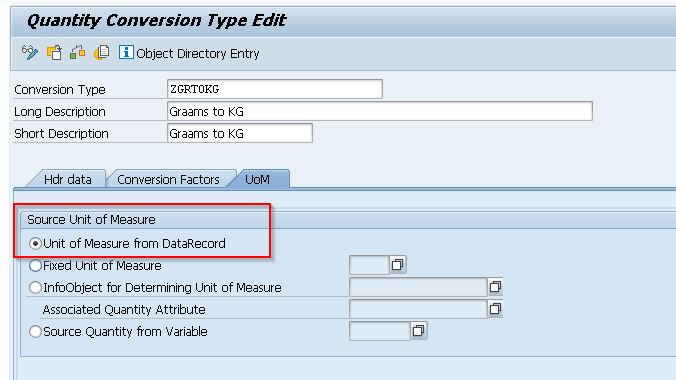
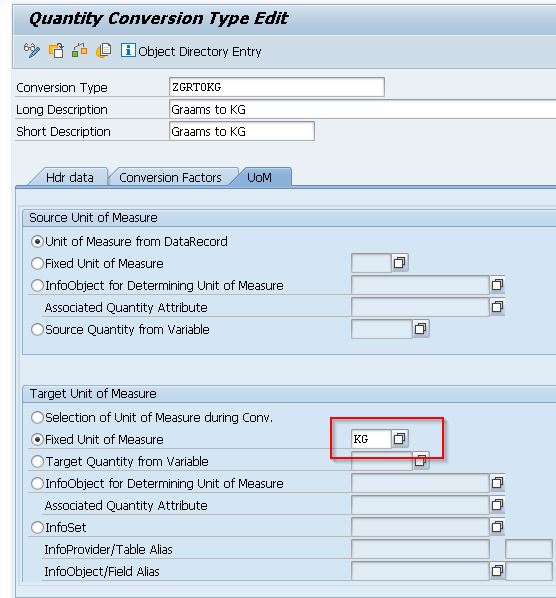
Here, what is source UOM? It is unit of measure from the data record. How does it know that it is grams? From the data record (T006) it knows from the above option. And for target we can choose a fixed unit as we want to set it equal to Kg or we can make it dynamic also.
Then, save your entries and do the following:
- Go to Query Designer
- Select Key figure (Quantity)
- Open Edit window
- Select Conversions tab
Now, we can see this conversion type in the Unit Conversion section. We can select this type, save and run it.
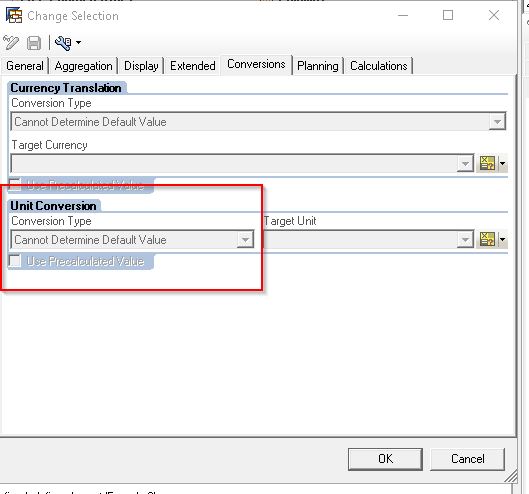
Only for Quantity type key figures we will do unit conversions.
Next, we also have Currency Translation. Currency Translation is used to convert the key figures with different currencies. It is available for key figures of type amount. Here, we can define the way the amount needs to be converted by specifying the conversion type. In the same way as units of measure all currency conversions are maintained in a special table called TCURR. It is a standard table. We need to replicate TCURR table from SAP ECC to BW and for this we also have to create a Currency Conversion Type.
These are the steps to do it:
Step 1: First, we need to create a conversion type with the transaction RSCUR. Give a proper currency translation type description and create it.
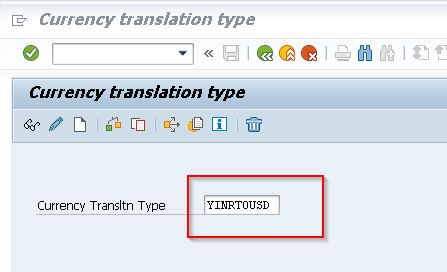
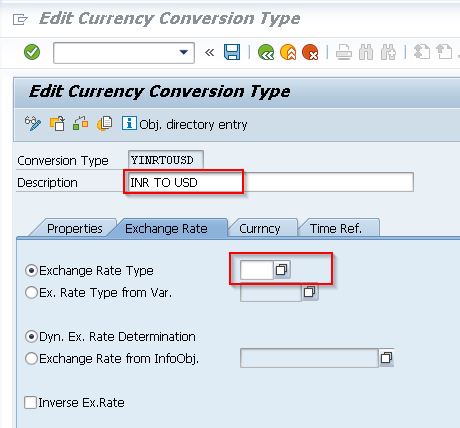
Step 2: Enter Description and select ‘Exchange Rate Type’ in Exchange Rate tab.
Step 3: Go to the Currency tab. Then, select source currency as ‘Source Currency from Data Record’ and target currency as ‘Fixed Target Currency’.
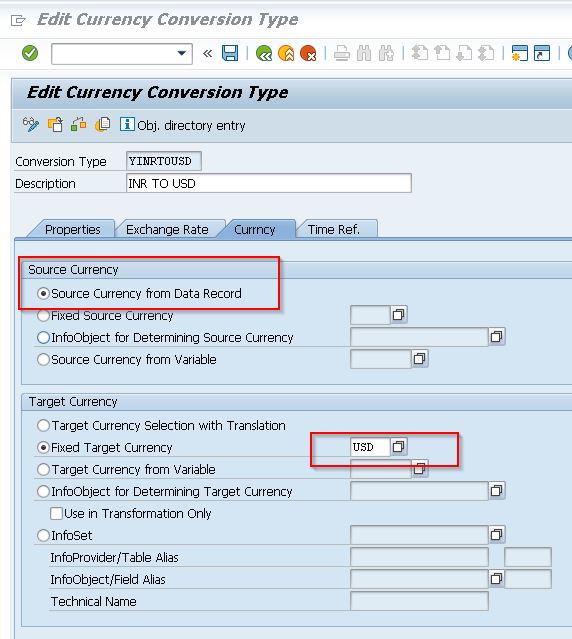
Next, save your entries and do the following:
- Go to Query Designer
- Select Key Figure (Revenue)
- Open Edit properties
- Select Conversions tab
In the Conversion tab, we can see our new conversion type under Currency Translation. Select it, save SAP key figures properties, and run the report.
Calculations Tab
This tab in SAP key figures properties is useful for the query level calculations and their descriptions. In this tab, SAP system allows us to define the way we want the results calculated in the report.
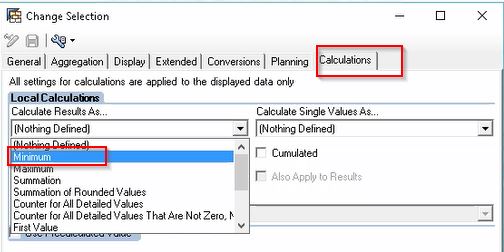
For example, if we select ‘Calculate Result As’ equal to ‘Minimum’, then it will display the smallest value for the corresponding area.
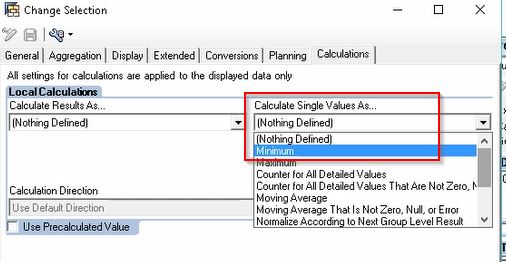
If we select ‘Calculate Single Value as’ equal to ‘Minimum’, then it will display the minimum key figure value for a characteristic.
Planning Tab
This tab is used for planning applications. Here, we can choose different option for planning. Input-ready queries are used to create applications for manual planning. These can range from simple data entry scenarios to complex planning applications.
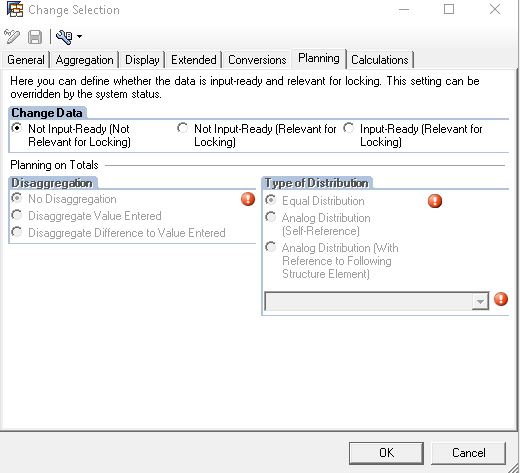
—
Did you like this tutorial? Have any questions or comments? We would love to hear your feedback in the comments section below. It’d be a big help for us, and hopefully it’s something we can address for you in improvement of our free SAP BW tutorials.
Navigation Links
Go to next lesson: SAP BW Structures
Go to previous lesson: SAP Calculated Key Figures
Go to overview of the course: SAP BW Training
